. 2019 Oct 1;8:e46965. doi: 10.7554/eLife.46965

Figure 5. Amplitude (μV) of the MMN for each group (MM vs. NH) as a function of age (cross-sectional study).

Individual (shapes) and group (lines) data are shown for each condition (nonspeech = circles; speech-like = triangles, speech = squares) for the MM (orange) and NH (blue) groups. Shaded lines represent the 95% confidence interval. For illustrative purposes, age is represented as a continuous variable, but was treated as a categorical variable (Y vs. O) in the analyses (see text). The grey vertical lines on each subplot represent the median age split into the Y (left of the line) and O (right of the line) age bands. Children in the MM-O subgroup obtained MMNs that were smaller in amplitude than those of their NH peers (NH-O subgroup).

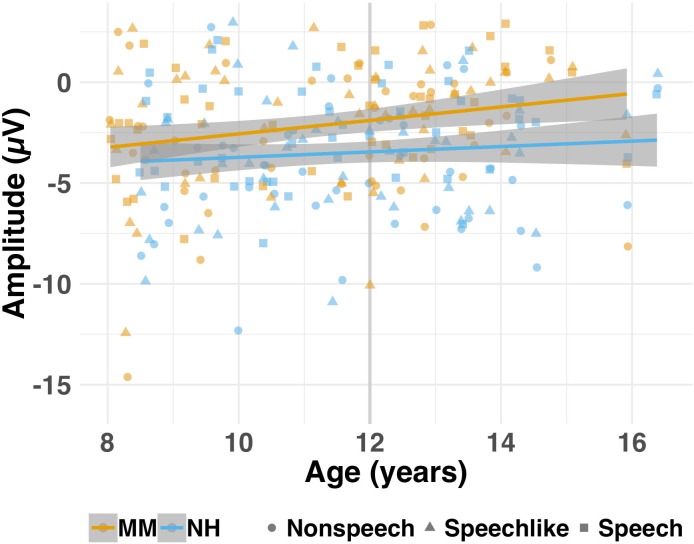
Figure 5.

Figure 5—figure supplement 1. Amplitude (μV) and latency (ms) of the LAER components (P1, N1, P2, and N2), where present, for each group (MM vs. NH) as a function of age (cross-sectional study).

Figure 5—figure supplement 1.

Individual (shapes) and group (lines) data are shown for each condition (nonspeech = circles; speech-like = triangles, speech = squares) and component for the MM (orange) and NH (blue) groups. Shaded lines represent the 95% confidence interval. For illustrative purposes, age is represented as a continuous variable, but was treated as a categorical variable (Y vs. O in the analyses, see main text). The grey vertical lines on each subplot represent the median age split into the Y (left of the line) and O (right of the line) age bands. Across ages and conditions, children with MMHL on average shoed P1s and P2s that were later than, and N2s that were smaller than, those of their NH peers, where these components were present.