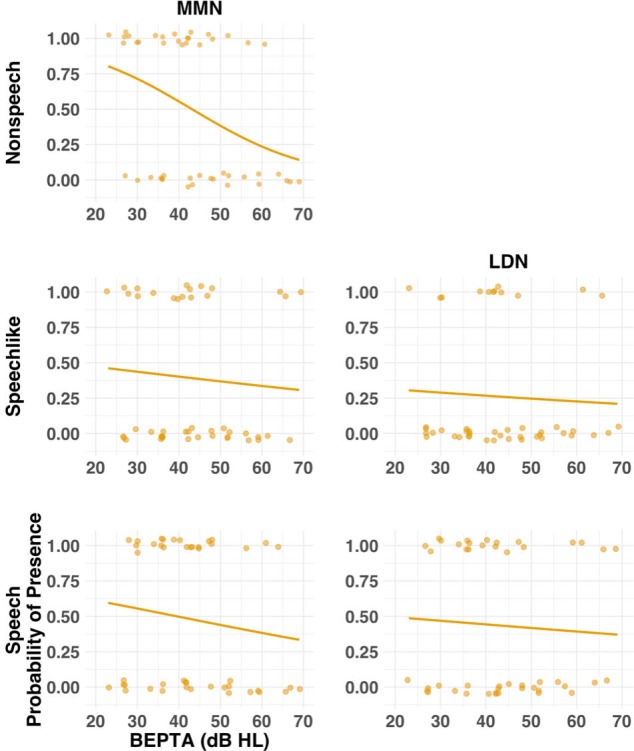
Figure 7. Probability of presence of the MMN and LDN for the MM group as a function of severity of hearing loss (cross-sectional study).

Individual (circles) and group (lines) data are shown for each condition (nonspeech, speech-like, speech) and response where present for the NH group. Solid lines result from a logistic regression fitting a general linear model with BEPTA as a predictor and presence of the response as the outcome variable. Worse BEPTA thresholds were associated with reduced likelihood of presence of the MMN and LDN in all conditions.
