. 2019 Oct 1;8:e46965. doi: 10.7554/eLife.46965

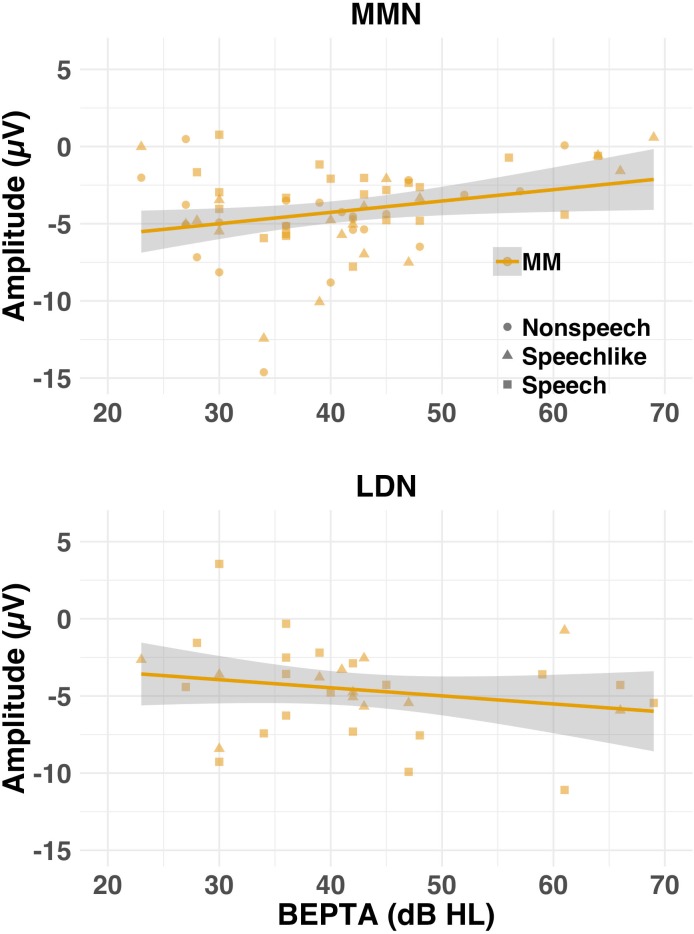
Figure 9. Amplitude (μV) of the MMN (top row) and LDN (bottom row) where present for the MM group as a function of severity of hearing loss (cross-sectional study).

Individual (shapes) and group (lines) data are shown for each condition (nonspeech = circles; speech-like = triangles; speech = squares) and response. Shaded lines represent the 95% confidence interval. Worse BEPTA thresholds were associated with smaller MMN, but not LDN, amplitudes, where present.

Figure 9.

Figure 9—figure supplement 1. Amplitude (μV) of the MMN as a function of age of fitting with hearing aids (in months).
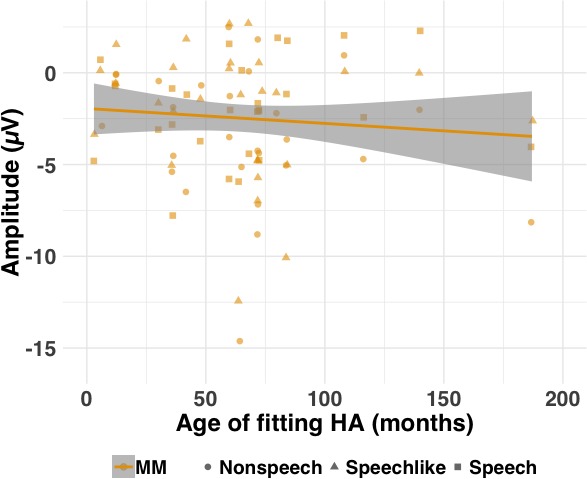
Figure 9—figure supplement 1.

Individual (shapes) data are shown for each condition (nonspeech = circles; speech-like = triangles, speech = squares) for the MM group. Shaded lines represent the 95% confidence interval. Note that the age at which children with MMHL were first fit with their hearing aids was correlated with BEPTA thresholds (r = −0.546, df = 28, p=0.002); That is, children with lower (better) BEPTA thresholds tended to receive their hearing aids later. Therefore, a partial correlation between MMN amplitude and age of first hearing aid fitting was computed, with BEPTA threshold as a covariate. This partial correlation failed to reach significance (pr = 0.246, df = 28, p=0.190).