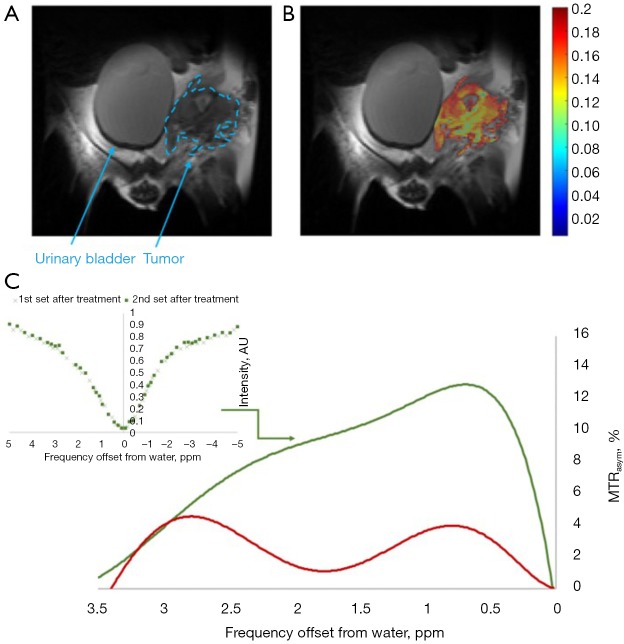
Figure 10.
In vivo 2OMG CEST MRI measurements in a 4T1 tumor (7T field). (A) A T2-RARE anatomical image before administration of the agent; (B) MTRasym image at 1.0 ppm following treatment with 2OMG (3 g/kg, IP), overlaid onto the T2 anatomical image; (C) The MTRasym plots for 4T1 tumor before (red curve) and after treatment (green curve) with 2OMG. In the inset: full Z spectra for 4T1 tumor at two-time periods following administration of 2OMG; total estimated time of scan was 80 min (same CEST protocol as described in Figure 8 caption). Rivlin M, 2018, unpublished results.

