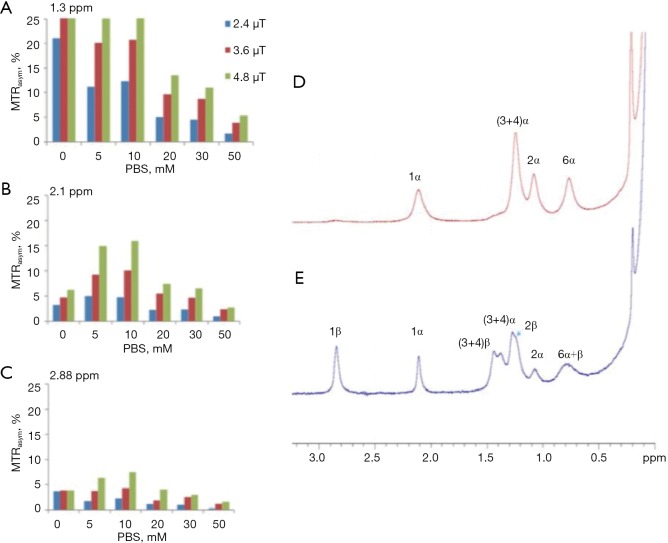
Figure 2.
Bar graph showing % of MTRasym of 20 mM D-Glc solution (10% D2O) at several PBS concentrations at the typical frequency offsets of the hydroxyl peaks (A) 1.3 ppm, (B) 2.1 ppm and (C) 2.88 ppm from the water peak (T=37 °C, 11.7T). (The peak at 0.66 ppm that belongs to the hydroxyl peak at the 6-position of D-Glc was not included in the MTR calculations because of its proximity to the water signal.) 1H NMR spectra of the hydroxyl protons of 0.1 M D-Glc solution (T=4 °C, pH=5.4, 11.7T). Spectra were recorded on a fresh sample (D) and several hours after the sample preparation (E). MTRasym, magnetization transfer asymmetry.

