Figure 8.
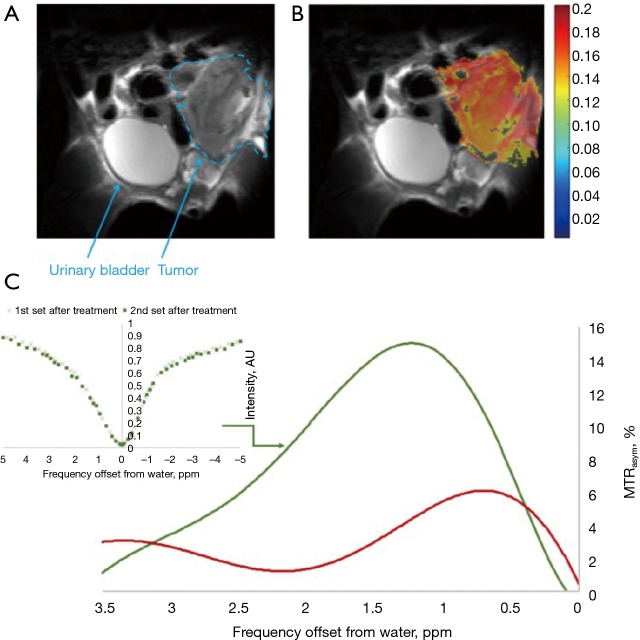
In vivo 6DG CEST MRI measurements in a 4T1 tumor (7T field). (A) A T2-RARE anatomical image before administration of the agent; (B) MTRasym image at 1.2 ppm following treatment with 6DG (2.0 g/kg, IP), overlaid onto the T2 anatomical image; (C) The MTRasym plots for 4T1 tumor before (red curve) and after treatment (green curve) with 6DG. In the inset: full Z spectra for 4T1 tumor at 2 time periods following administration of 6DG. Total estimated time of scan was 80 min for CW pulses of 2 s duration and attenuation of 2.5 µT (106 Hz) at 106 frequencies offsets that were divided into two series and sampled alternately and simultaneously. The mean intensities in the selected ROI in the tumor were used for the MTRasym plot. B0 inhomogeneity corrections were made (Rivlin M, 2018, unpublished results).

