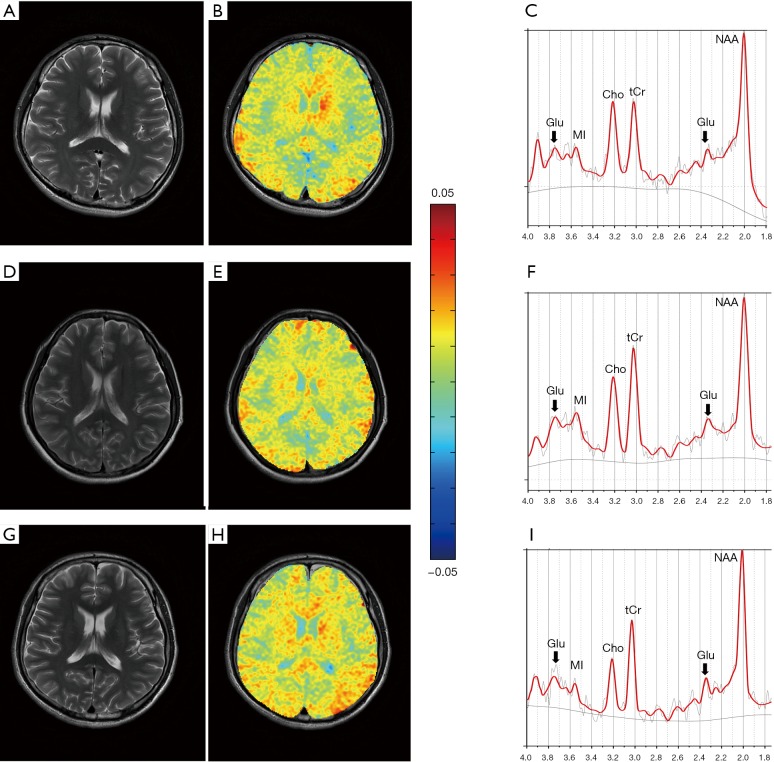
Figure 3.
T2WI image (A), GluCEST map (B), and MRS spectra of the LPWM (C) from a healthy control (male; 20 years old) with good cognition (MoCA =28); T2WI image (D), GluCEST map (E), and MRS spectra of the LPWM (F) from a TBI patient (female; 35 years old) with good cognitive outcome (MoCA =26) and T2WI image (G), GluCEST map (H), and MRS spectra of the LPWM (I) from a TBI patient (male; 43 years old) with a PCO (MoCA =23). The GluCEST map showed no significant difference between healthy control (B) and patient with good cognitive (F). The GluCEST map from the patient with a PCO (H) showed the increased GluCEST% value of LPWM, together with a concomitant increase in Glu peak as shown in the spectra (I, arrows), compared with the healthy control and the patient with good cognitive outcome. T2WI, T2-weighted images; GluCEST, glutamate chemical exchange saturation transfer; MRS, magnetic resonance spectroscopy; LPWM, left parietooccipital white matter; MoCA, Montreal Cognitive Assessment; PCO, poor cognitive outcome; Glu, glutamate; Cho, choline; NAA, N-acetylaspartate; tCr, total creatine.

