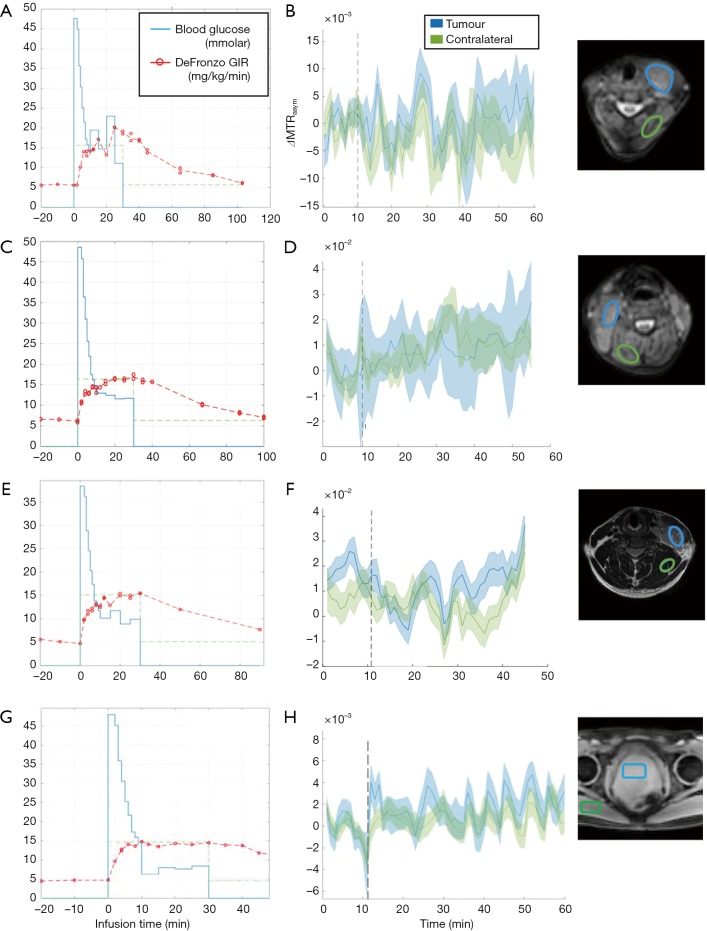
Figure 3.
Glucose infusion profile (A,C,E) vs. MTRasym signal (B,D,F) in three patients with lymphoma (patient 1 = A and B, patient 2 = C and D, patient 3 = E and F) and a patient with prostate cancer (G for glucose infusion profile and H for MTRasym signal). Glucose infusion starting time is displayed in a vertical dotted line (B,D,F,H). The reference images on the rightmost column show ROIs for which the signal changes are displayed. MTRasym, magnetization transfer ratio asymmetry.

