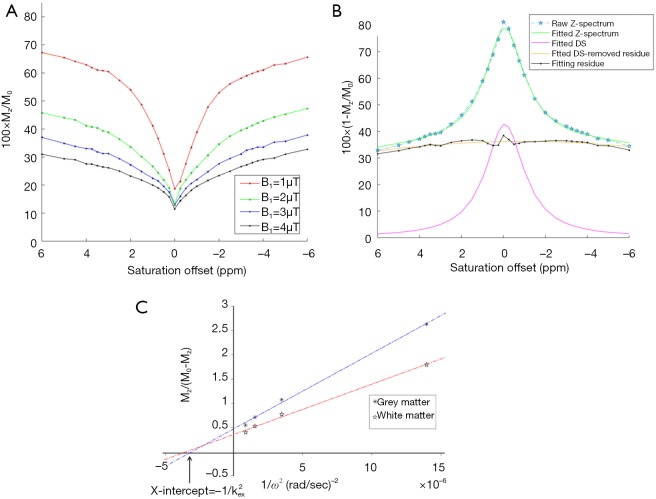
Figure 1.
Typical Z-spectra, their fittings and constructed omega plots for a healthy brain ROI. (A) Representative Z-spectra from a healthy brain plotted at [−6, 6] ppm for four different saturation powers =1–4 µT. Note the increase of CEST contrast with increasing saturation power, B1. (B) Representative (inversed) Z-spectrum from a healthy brain at B1=1 µT with Lorentzian fittings to remove water DS. DS was subtracted from the entire Z-spectrum and the residual spectrum was used for constructing the omega plot. (C) A typical omega plot, Mz/(M0−Mz) versus, constructed using values for gray (close stars) and white (open stars) matters in a representative healthy subject’s brain. The linearity of the plot is evident. The x-intercept of the fit to the omega-plot provides a direct readout of the exchange rate. ROI, region of interest; DS, direct saturation.

