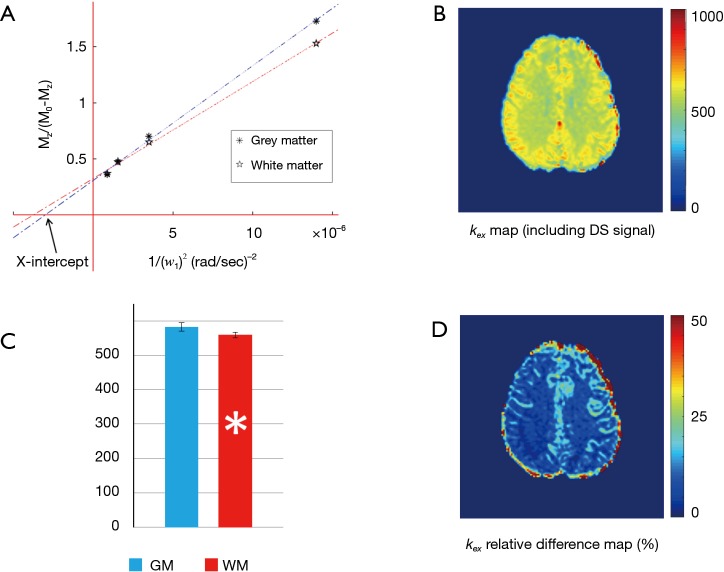
Figure 4.
Exchange rate map produced from unmodified Z-spectra. (A) Typical omega plot, constructed using unmodified Z-spectral signals for gray (close stars) and white (open stars) matter ROIs in a healthy subject’s brain. The plot shows linear dependency. (B) The saturation transfer exchanging rate map derived from unmodified Z-spectral signals. Compared to map constructed using the DS-removed Z-spectra (Figure 2B), the values are generally lower and the contrast between gray and white matters appears to be reduced. (C) GM regions still show significant higher exchange rate than WM (582±25 vs. 559±17 s−1, *P<0.005). (D) Relative difference in the exchange rate values calculated with and without DS removal shows clear tissue type dependency by showing apparently higher difference in gray matter than white matter. ROIs, region of interests; DS, direct saturation; GM, gray matter; WM, white matter.

