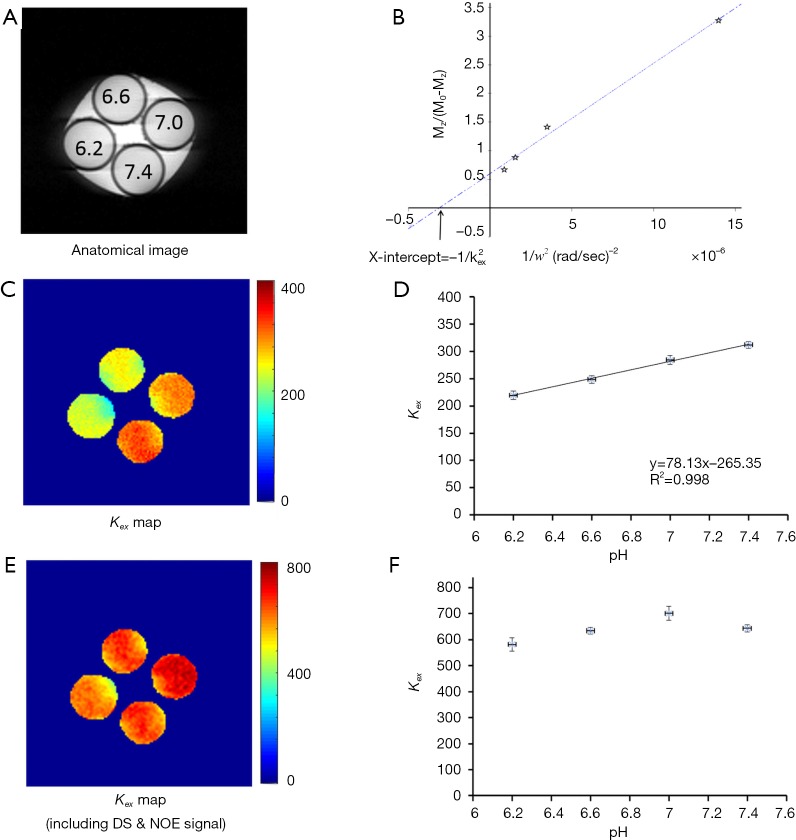
Figure 5.
Phantom study using BSA solutions at pH from 6.2 to 7.4. (A) T2-weighted anatomical image of the phantoms. (B) Typical omega plot, constructed using DS- & NOE-removed Z-spectra showing linear dependency. To avoid crowdedness, only one representative plot (at pH 6.6) is shown. The constructed proton exchange rate from DS- & NOE-removed Z-spectra showed that exchange rate increases with pH linearly (C,D). On the other hand, the constructed proton exchange rate from the raw Z-spectra failed to distinguish between different pH and did not show linear dependency on pH (E,F). BSA, bovine serum albumin; DS, direct saturation; NOE, nuclear Overhauser enhancement.

