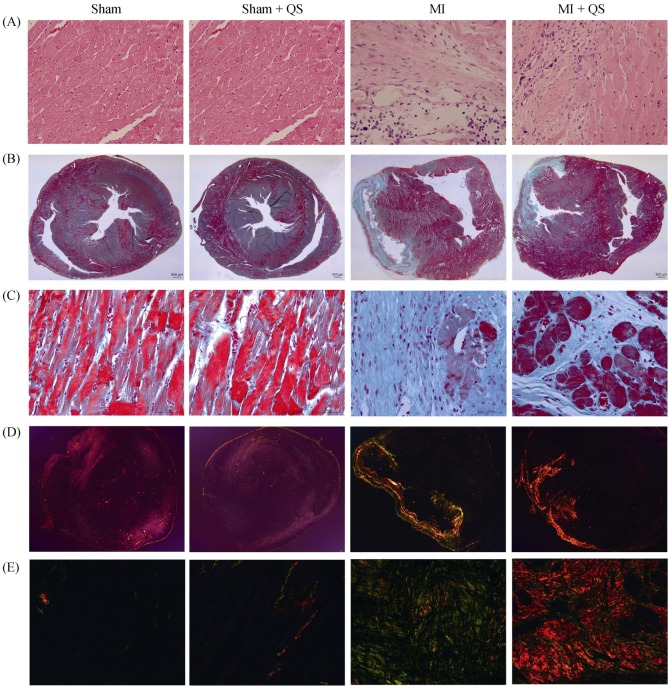
Figure 3. Histopathological staining.
(A): Inflammatory cell infiltration shown with Hematoxylin-eosin staining; (B): fibrosis shown with Masson's trichrome staining (12.5 ×); (C): fibrosis shown with Masson's trichrome staining (400 ×); (D): picrosirius red staining to detect the collagen content within the infarct zone (12.5 ×); and (E): picrosirius red staining to detect the collagen content within the infarct zone (400 ×). n = 3 in each group. MI: myocardial infarction; QS: Qishen capsule.

