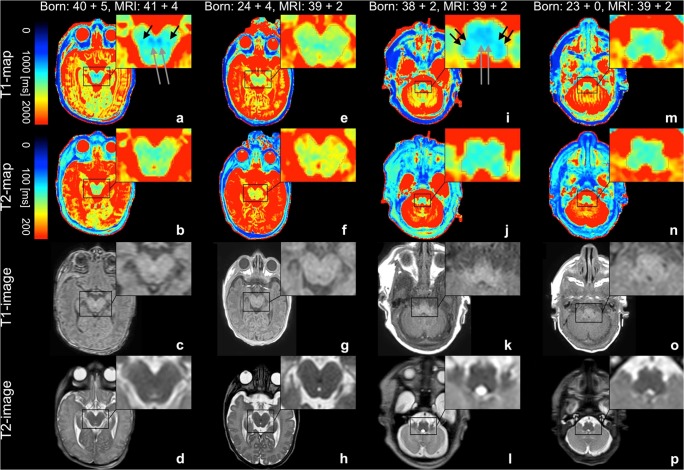
Fig. 2.
Quantitative T1-/T2-maps are shown in the upper row. T1- and T2-relaxation constants are represented by the colored bars. Conventional T1-/T2-weighted images are shown in the bottom row. a–d and i–l Data from a term-born infant. e–h and m–p Data from a former premature infant. The quantitative T1-map of the midbrain of the term-born neonate (a) shows a distinct myelination of the brachium conjunctivum (long arrows) and medial lemniscus (short arrows). A corresponding signal is far less detectable on the T2-map (b) and completely absent in the preterm neonate (e, f). Conventional MR images of the midbrain are shown for comparison (c, d, g, h). The quantitative T1-map of the medulla oblongata of the term-born neonate (i) shows a distinct myelination of the inferior cerebellar peduncle (short double arrows) and medial lemniscus (long double arrow). A corresponding signal is far less detectable on the T2-map (j) and completely absent in the preterm neonate (m, n). Conventional MR images of the medulla oblongata are shown for comparison (k, l, o, p)

