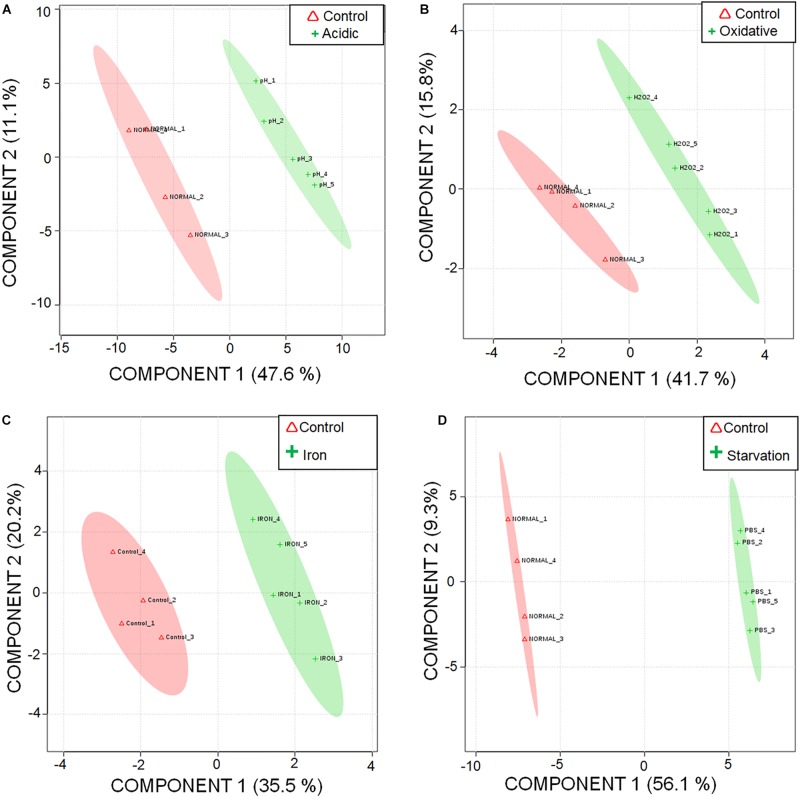
FIGURE 1.
Segregation of metabolic profiles of acidic stress, oxidative stress, iron deprivation, and nutrient starvation from control using Partial Least Squares – Discriminant Analysis (PLS-DA). 2D score plot of (A) acidic stress vs. control; (B) oxidative stress vs. control; (C) iron deprivation (iron) vs. control; and (D) nutrient starvation vs. control are shown.

