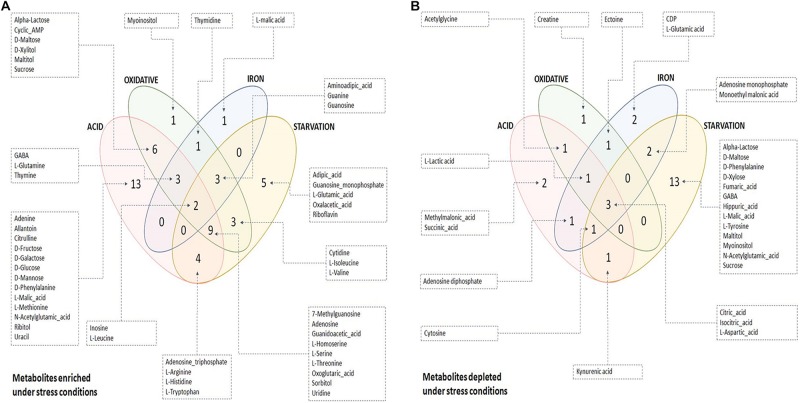
FIGURE 2.
Euler diagrams depicting differentially abundant metabolites during stress conditions. (A) Metabolites enriched during stress with respect to control condition; (B) metabolites depleted during stress with respect to control condition. Only key metabolites differentiating between control and stress, as identified in PLS-DA analysis (VIP score ≥ 1), have been indicated in the diagram. The complete list of differentiating metabolites is provided in Supplementary Table S4.

