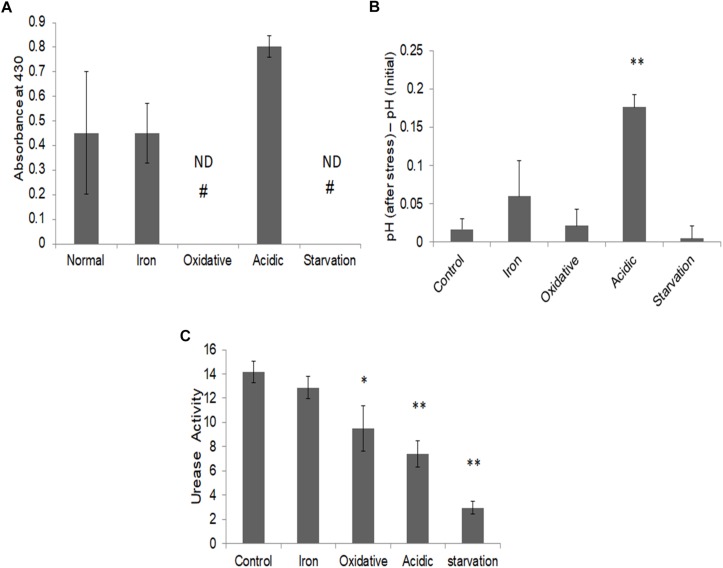
FIGURE 6.
Ammonia release and alleviation of stress. (A) Ammonia estimation post stress in the respective culture media supernatant using Nessler’s assay as assessed by absorbance at 430 nm normalized to respective blank; (B) Measurement of change in pH in M.tb culture post stresses; and (C) urease activity (in terms of ammonia nmol/mg protein/min) in M.tb cell lysates post stress measured by using urease activity assay kit (ab204697, Abcam Plc., United Kingdom). ∗∗Indicated p-value < 0.005 and ∗ indicated p-value < 0.05 as compared to control. # ND, not detectable.

