Figure 2.
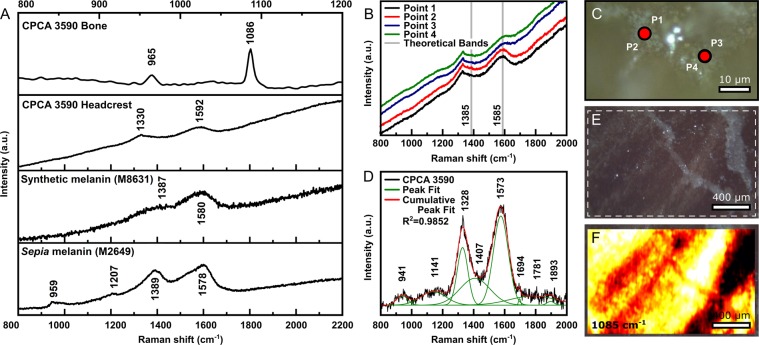
Raman spectra from T. imperator (CPCA 3590) headcrest and melanins. (A) The top spectrum is from the bony area of the headcrest showing peaks of CO32− (at 1086 cm−1) and PO43− (at 965 cm−1), which is consistent with a bioapatite variety. The second spectrum is that of the headcrest, and is similar to the two shown below, those of synthetic and Sepia melanins, respectively. (B) Raman spectra from dark bands of the headcrest exhibiting a signal variation between the two regions of measurement (red circles indicate the two points where four measurements were made) (C). Grey dashed lines in (B) represent the theoretical bands of eumelanin. (D) Fitted spectra using Gaussian function (R2 = 0.9852) from the Point 1 seen in (B), showing that multiple bands are also observed as predicted in other studies. (E) Microscopic image from the headcrest surface, showing the region where the fluorescence mapping was performed (white dashed lines). (F) Map of the 1085 cm−1 region that is diagnostic of calcite, from the area seen in (E), indicating a faint signal of the soft tissues, suggesting that calcite from matrix predominates.

