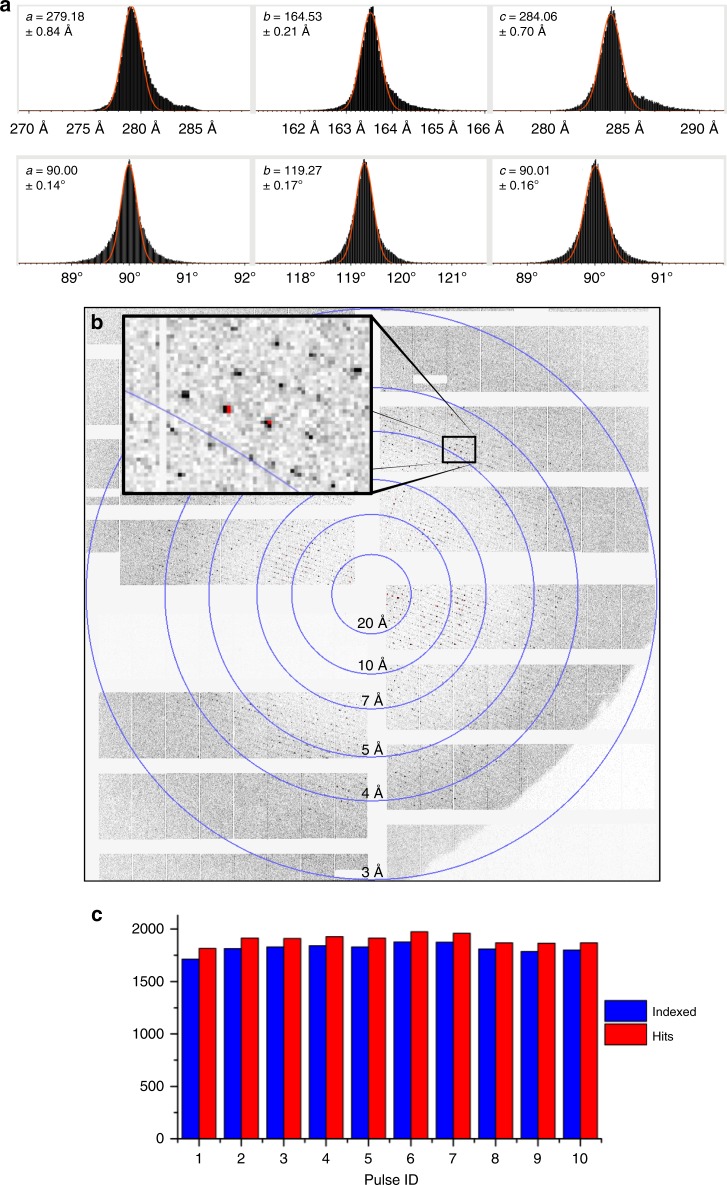
Fig. 2.
Unit cell distribution, diffraction pattern, and indexing rates from PSI MHz SFX. a Unit cell distributions of PSI microcrystals showing narrowly distributed monoclinic unit cells. The red line shows a Gaussian function fit to the unit cell constant distribution, and the corresponding peak value is listed in each subpanel. b Representative X-ray diffraction pattern with pixels in high-gain mode shown in black, and medium- or low-gain mode shown in red. Resolution rings are shown and labeled accordingly. c The number of hits (red) and indexed patterns (blue, ~93% of hits) for each pulse

