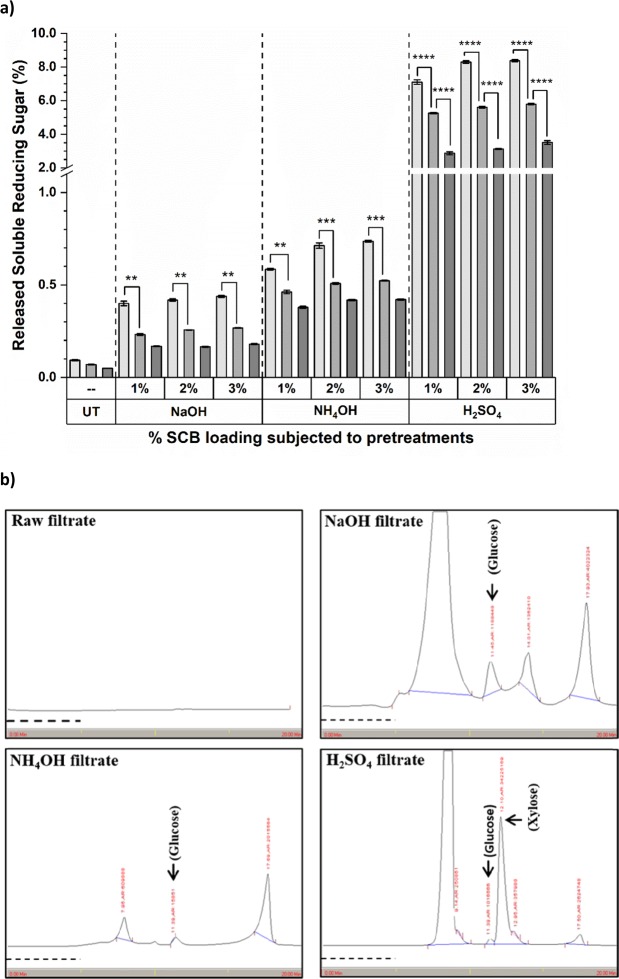
Figure 1.
Release of soluble components in pretreatment filtrate from raw and PSCB. (a) Release of % SRS in pretreatment filtrate from raw untreated control, NaOH, NH4OH and H2SO4 pretreatments; Significance difference between 1.25% ( ), 2.5% (
 ) and 5.0% (
 ) SCB biomass loading for pretreatments is given as *p < 0.05, **p < 0.01, ***p < 0.001 and ****p < 0.0001 for Sidek test-Two-way ANOVA analysis; Values presented are Mean ± Standard Errors of the Mean (SEM), for n = 3. (b) Representative chromatographs of HPLC analysis for pretreatment filtrates of 5% (w/v) loading of SCB for Raw untreated control, 3% NaOH, 3% NH4OH and 3% H2SO4 pretreatment; RT: Glucose ~11.4 min, Xylose ~12.1 min; Dashed line (
 ) at X-axis indicates the time span of 5 min on chromatogram; n = 3.

