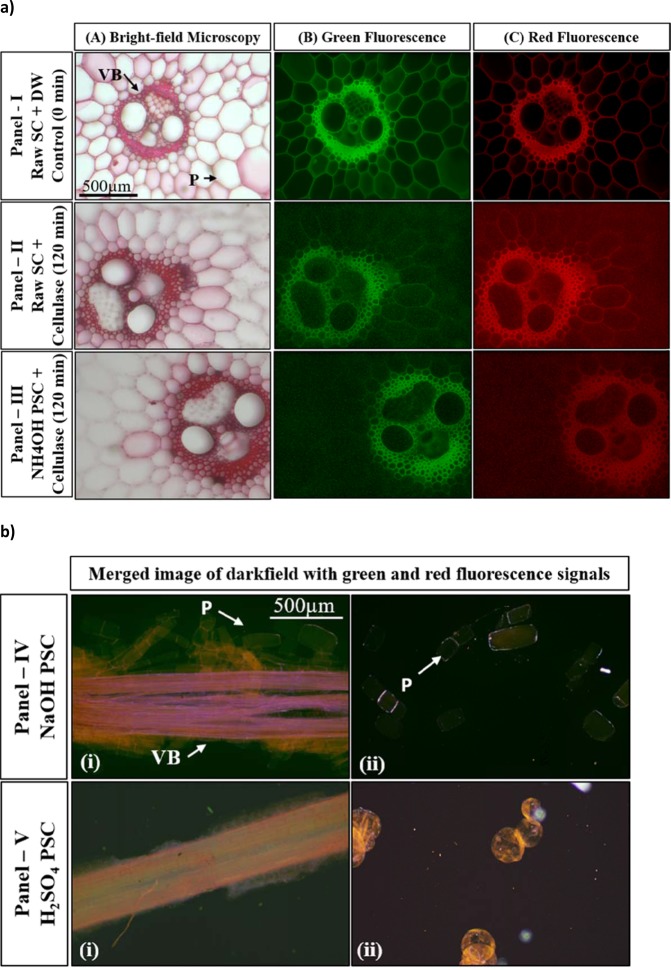
Figure 6.
Brightfield and fluorescence microscopy analysis of safranin stained pretreated Sugarcane (SC) biomass. (a) Panel-I-III: Brightfield and fluorescence microscopy of safranin stained raw and NH4OH pretreated SC transverse sections before and after incubation with cellulase: Panel I- Raw SC before enzyme treatment, Panel II- Raw SC and Panel III- NH4OH pretreated SC after 120 min of cellulase treatment; Images captured for Brightfield micrograph (Column A), Green fluorescence signal (Column B) and Red fluorescence signal (Column C); Images are taken at 10X magnification; (b) Brightfield microscopy of safranin stained NaOH treated (Panel IV) and H2SO4 pretreated (Panel V) sugarcane biomass fraction: (i) Fibrous vascular bundle (labelled as FVB) and the fragments of surrounding parenchymatous pith cells; (ii) Individual cells of pith parenchyma separated after NaOH and H2SO4 pretreatments (All images at 10X magnification).

