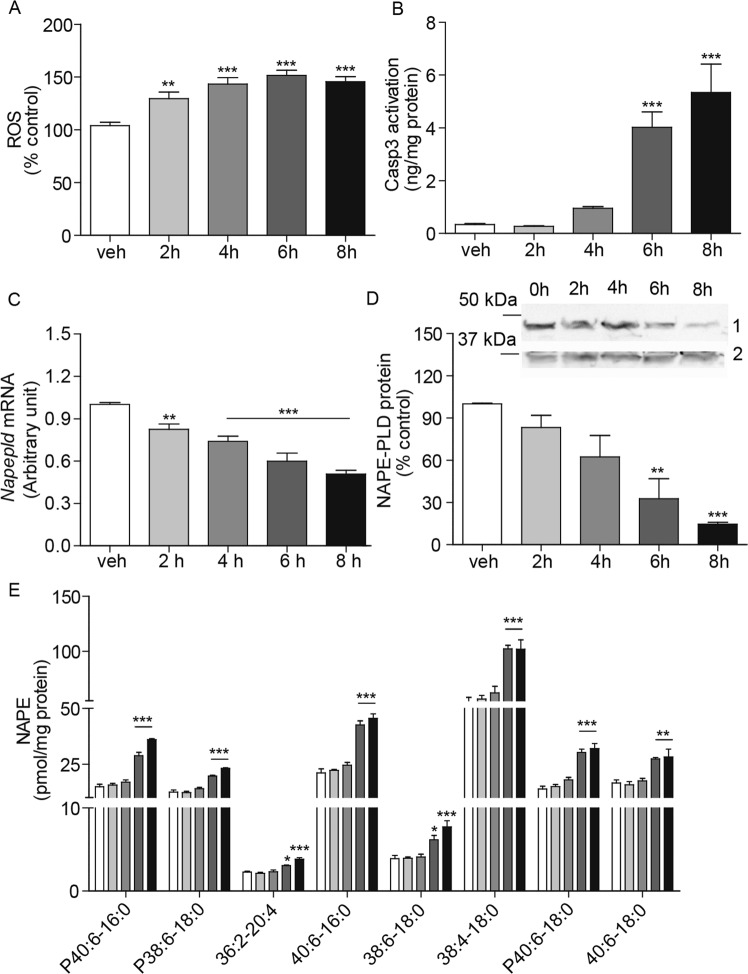
Figure 5.
6-OHDA-induced toxicity in SH-SY5Y cells. Time-course measurements of SH-SY5Y cells incubated in the presence of 6-OHDA (100 µM) for 2 to 8 h. (A) Reactive oxygen species (ROS), expressed as percent of levels in vehicle-treated cells; (B) Active Caspase-3 (Casp3), expressed as ng per mg of protein (n = 9–14); (C) Napepld transcription, expressed as arbitrary units after normalization (see Methods) (n = 9); and (D) NAPE-PLD protein levels; top, representative western blot, bottom, densitometric quantification, expressed as percent of control. GAPDH was used for normalization (n = 3). Full-length blots are presented in Supplementary. (E) Individual NAPE levels (n = 3). *P < 0.05, **P < 0.01, ***P < 0.001, one-way ANOVA with Bonferroni post hoc test.

