Figure 6.
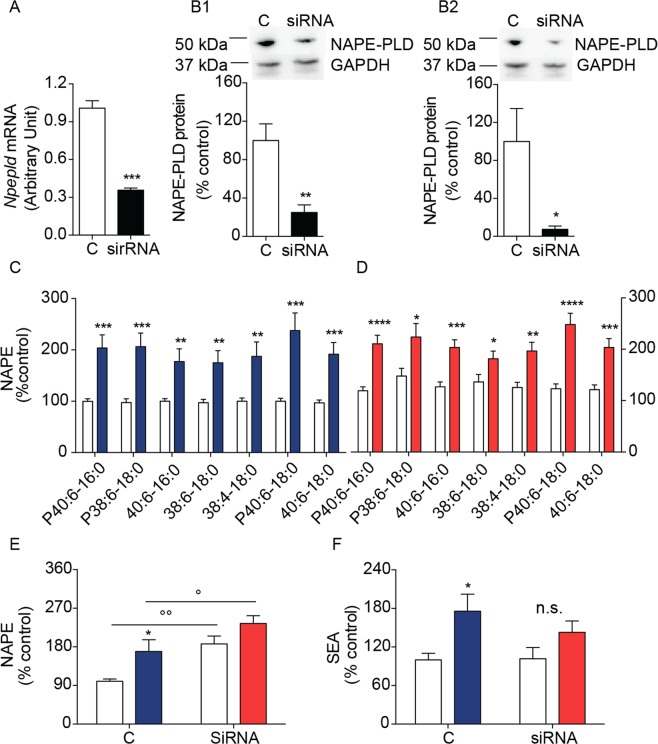
Effects of siRNA-induced NAPE-PLD silencing on NAPE and FAE levels in SH-SY5Y cells. (A) Napepld transcription and (B1, B2) NAPE-PLD protein levels in SH-SY5Y cells treated for 24 h with scrambled (C, open bar) or siRNA oligonucleotide (closed bar) (n = 8); (B1) membrane and (B2) cytosolic fractions: top, representative blot; bottom, densitometric quantification (expressed as percent control) (n = 3–5). Full-length blots/gels are presented in Supplementary. *P < 0.05, **P < 0.01, ***P < 0.001 two-tailed Student’s t-test. (C,D) NAPE levels in scrambled (C) and NAPE-PLD silenced (D) SH-SY5Y cells after 8 h of 6-OHDA incubation (n = 15 and 10 respectively). Open bars: control cells; color-coded bars: 6-OHDA-treated scrambled cells (blue), 6-OHDA-treated NAPE-PLD-silenced cells (red). (E) Total NAPE levels in SH-SY5Y cells treated for 24 h with scrambled (C) or siRNA oligonucleotide (siRNA). (F) SEA levels in SH-SY5Y cells treated for 24 h with scrambled (C) or siRNA oligonucleotide (siRNA). Open bars: control cells; color-coded bars: 6-OHDA-treated scrambled cells (blue), 6-OHDA-treated NAPE-PLD-silenced cells (red). *P < 0.05, **P < 0.01, ***P < 0.001 two-way ANOVA compared to scramble or vehicle-treated cells; °p < 0.05 °°p < 0.01 two-way ANOVA, Bonferroni post hoc test.

