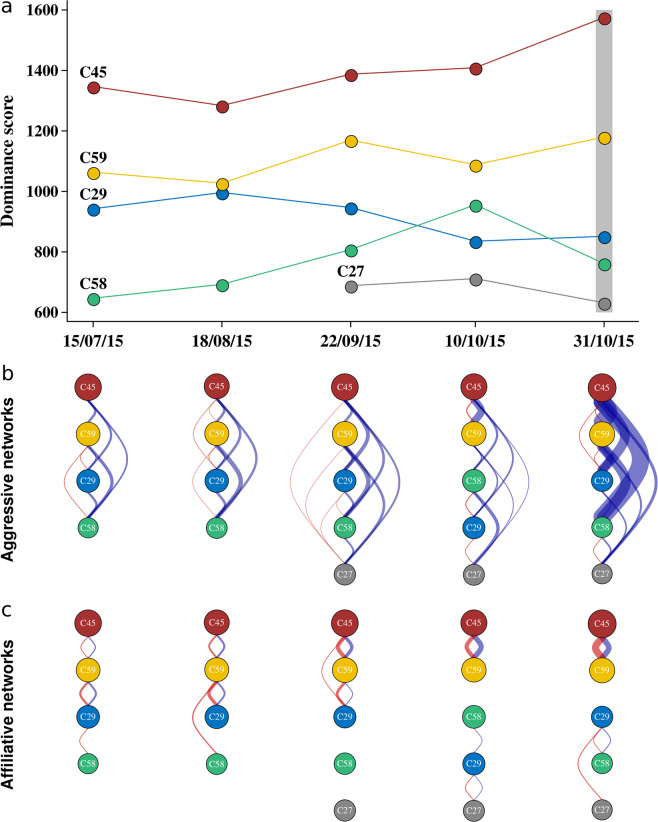
Figure 2.
Dominance hierarchies and social networks in a group of female carrion crows through time. (a) Change of dominance hierarchies as inferred by Elo-scores. The vertical grey rectangle indicates incidences of coalitionary aggression, in which C45 (red) and C59 (yellow) cooperatively attacked individual C58 (green). (b,c) Social networks of (b) aggressive and (c) affiliative interactions for each observation. The order and size of the nodes (circles) is proportional to individual dominance ranks. Edges (lines between individuals) represent interactions, with edges to the right of networks (blue) denoting higher-ranked individuals interacted with lower-ranked individuals, while edges on the left side of networks (in red) denote lower-ranked individuals interacted with higher-ranked individuals. Edge width reflects the number of interactions. Dominance hierarchies were visualised using the R51 package ggplot256, and social networks were created using the R package igraph60.

