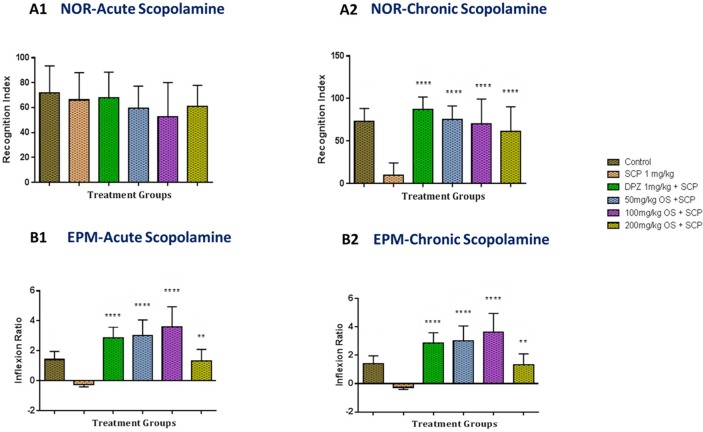
Figure 3.
Behavioral analysis for NOR and EPM. (A1 and A2) represents the graph plot for the recognition indices in NOR for both the acute and chronic scopolamine model respectively (B1 and B2) represents the graph plot for inflection ratios in EPM for both the acute and chronic scopolamine model. All the behavioral analysis was compared to the negative control (SCP 1 mg/kg). Data are expressed as Mean ± SEM, n = 8 and statistical analysis by one-way ANOVA followed by Dunnett test **P < 0.01 and ****P < 0.0001.

