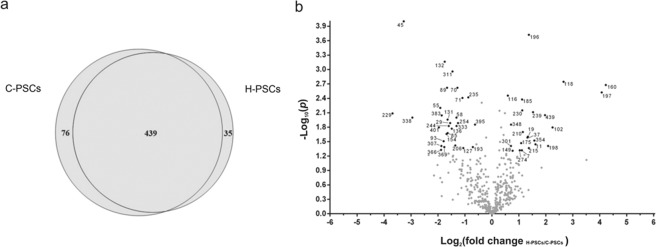
Figure 2.
Overview of the proteins identified in the C-PSCs and H-PSCs samples. (a) The numbers of proteins exclusively detected in each sample or shared between them are indicated in the diagram. Only proteins identified by at least two peptides and present in the two biological replicates were considered for analysis. (b) Volcano plot of proteins shared between C-PSCs and H-PSCs, with significant differences between samples. Proteins with a p value < 0.05 (−log10 = 1.3) and a fold-change (FC) > 1.5 (log2 = 0.5) were considered differentially abundant between H-PSC and C-PSC by both statistical and FC parameters and are represented by black dots and identified by their numbering in Table S4. Proteins without significant differences in abundance between samples according to the criteria above are shown as grey dots.

