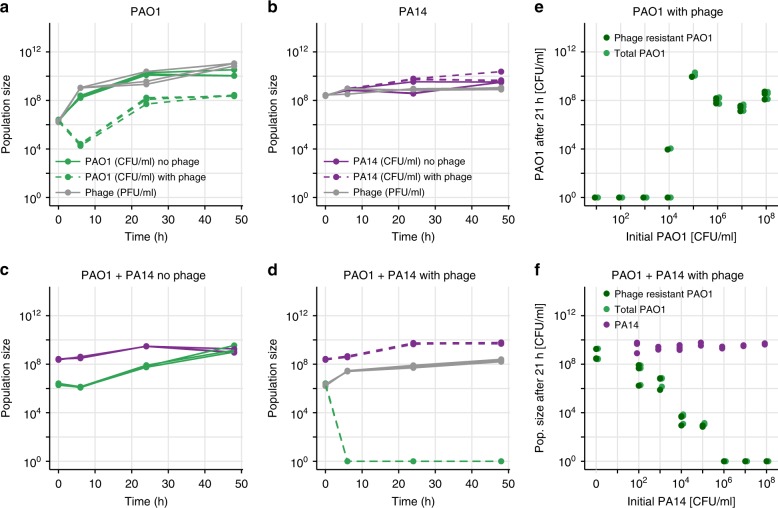
Fig. 1.
Phage efficacy in liquid. a Growth of PAO1 (in CFU/ml) in liquid over 48 h. PAO1 grew without phage (solid green lines), but in its presence (dashed green lines) PAO1 decreased then rebounded, resulting in a resistant population (statistics in main text). The phage population (in PFU/ml, gray lines) increased accordingly. b PA14 (phage-insensitive), grew similarly in the presence or absence of phage (dashed or solid purple lines, respectively), while phage (gray) remained approximately constant. c When PAO1 (green) and PA14 (purple) were grown in co-culture in the absence of phage, PAO1 grew worse than alone. d When phage were added to the co-culture, PAO1 population size dropped below the detection limit at 6 h and did not recover. e PAO1 was grown together with phage in triplicate at different initial population sizes (MOI = 1). At the end of the experiment, bacteria were plated onto agar plates saturated with phage or not to count the resistant and total population (see Methods). A starting population size greater than ~ allowed resistance to emerge. f Initial population size of PAO1 was always ~, while initial PA14 numbers varied as on the x-axis. Once PA14 became too numerous (greater than ~), PAO1 could no longer maintain its population size high enough for resistance to the phage to emerge. Purple, light green and dark green points show population size of PA14, total PAO1 and resistant PAO1, respectively, at 21 h. All panels show raw data coming from three technical replicates

