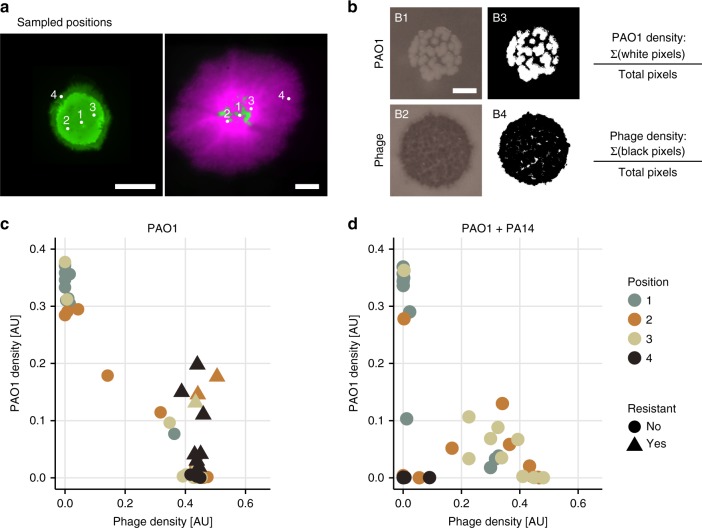
Fig. 4.
Sampling colonies to determine co-occurrence patterns of phage and bacteria. a The white dots indicate where we sampled in each colony using sterile toothpicks (same images as in Fig. 2b). Position 2 and 3 were approximately equidistant from the center (position 1). The scalebars indicate 2 mm. b The toothpick-attached cells and phage were resuspended and a small drop of the suspension placed on LB agar containing gentamicin, and on soft LB agar containing PAO1. B1 and B2 are two representative images of these drops after ~15 h at 37 °C. The scalebar indicates 3 mm. To quantify the density of bacteria and phage, we applied a threshold to the images (B3 and B4) and then calculated the proportion of white and black pixels in each picture respectively. These values are plotted in panels c and d. c, d Density of PAO1 and phage in each sample. Each dot or triangle corresponds to a sample in one position in one colony. c, d show samples taken from 10 PAO1 and 10 mixed colonies, respectively (4 × 10 = 40 points on each plot). Resistance was determined by similarly thresholding images of drops grown on LB agar with gentamicin and saturated with ~ phage (see Supplementary Figs. 8, 9 for the full data set). The different colors represent the positions sampled as shown in panel a. Sampled positions are approximate

