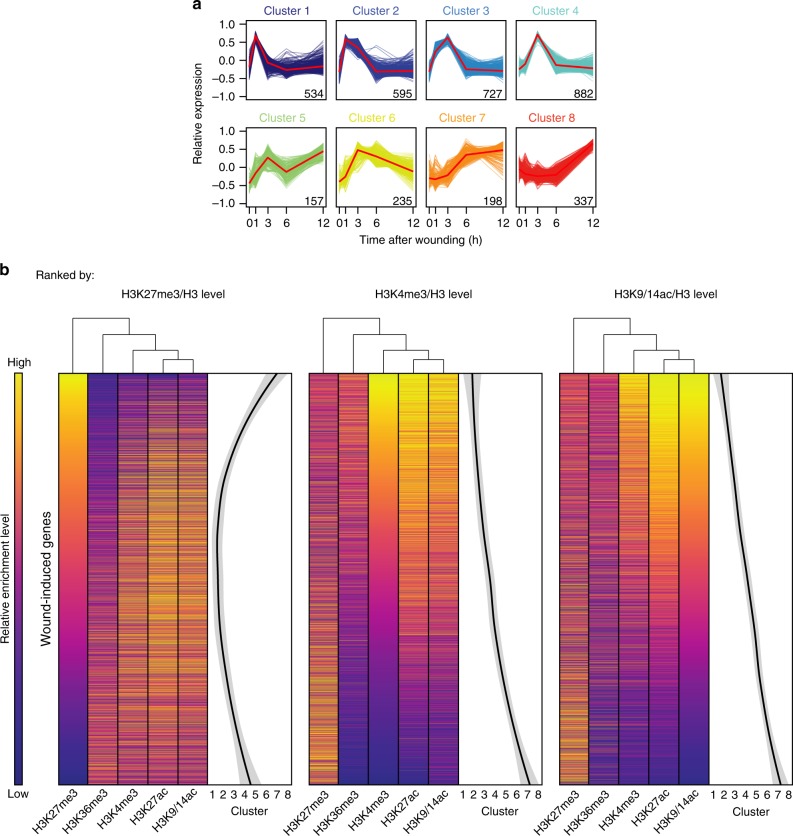
Fig. 2.
Genes rapidly induced by wounding are marked with H3K9/14ac and H3K27ac before wounding. a K-means clustering of genes significantly induced by wounding (FC > 1.5, FDR corrected p values (edgeR test) < 0.001, n = 3665 genes). Clusters are ordered from most rapidly (cluster 1) to most slowly (cluster 8) induced genes. The number of genes included in each cluster is indicated and red lines show the average level of their expression. b Heat map-based comparison of the relative enrichment levels of pre-wound H3K27me3, H3K36me3, H3K4me3, H3K27ac, and H3K9/14ac and the timing of transcriptional induction after wounding, using a LOESS regression. Genes are sorted based on their relative enrichment levels of pre-wound H3K27me3, H3K4me3, or H3K9/14ac

