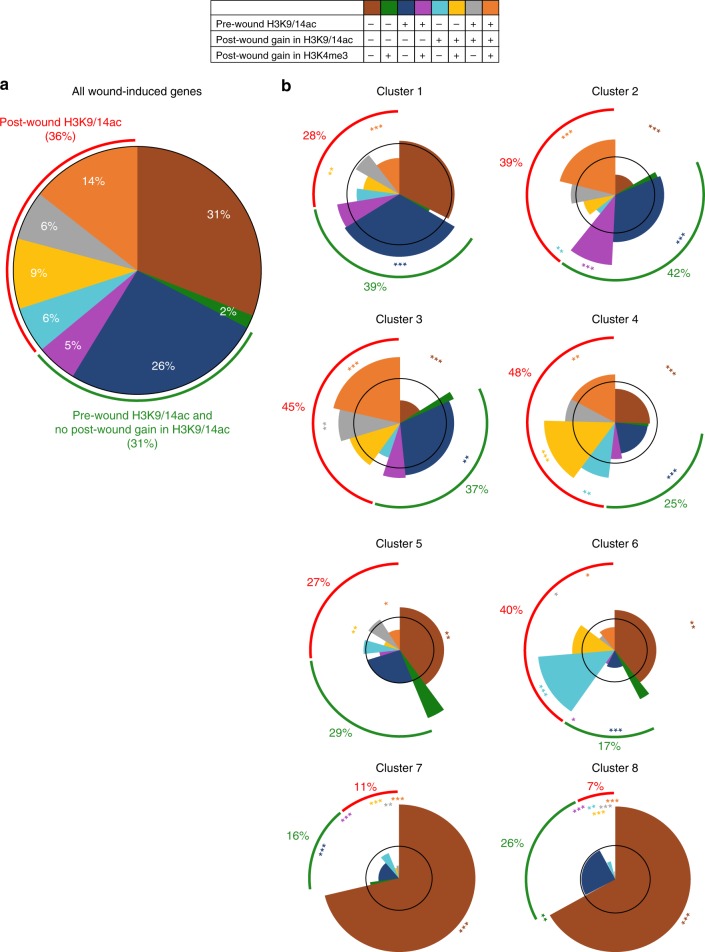
Fig. 4.
Wound-induced increase of H3K9/K14ac marking is associated with slower transcriptional activation. a Pie chart representing the percentage of genes associated with pre-wound H3K9/K14ac, post-wound H3K9/14ac and/or H3K4me3 among 3665 wound-induced genes. Genes are grouped based on their association with H3K9/14ac. b Spie chart representing the percentage of genes associated with pre-wound H3K9/K14ac, post-wound H3K9/14ac and/or post-wound H3K4me3 among genes within clusters 1–8. Genes are grouped based on their association with H3K9/14ac. The radii of the wedges correspond to the representation factor (hypergeometric test) of the epigenetic category in the cluster compared to its representation among all wound-induced genes. The black circle corresponds to a representation factor of 1 so that wedges inside the circle depict an underrepresented category and wedges that extend beyond the circle depict an overrepresented category. *p < 0.05, **p < 0.01, ***p < 0.001 (hypergeometric test)

