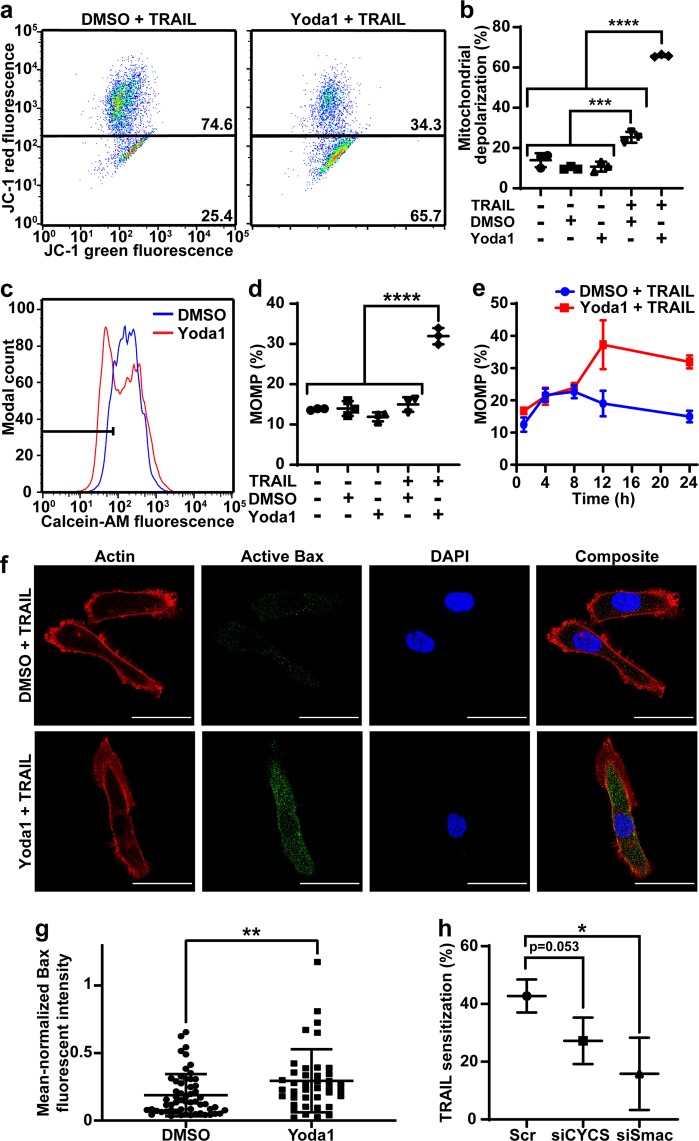
Fig. 3. Yoda1 and TRAIL induce mitochondrial dysfunction.
a Representative flow plots of JC-1 assay after Yoda1 or DMSO and TRAIL treatment. b Percent of cells with depolarized mitochondria after DMSO or Yoda1 and TRAIL treatment (n = 3). c Flow plots of MOMP due to DMSO or Yoda1 and TRAIL treatment. d Average MOMP of PC3 cells after treatment with DMSO or Yoda1 and TRAIL (n = 3). e MOMP of PC3 cells treated with DMSO or Yoda1 and TRAIL at 1, 4, 8, 12, and 24 h timepoints (n = 3). f Representative images of Bax activation of PC3 cells treated with DMSO or Yoda1 and TRAIL. The red channel is actin, green is active Bax, and blue is DAPI. Scale bars = 20 µm. g Fluorescent intensity of active Bax in PC3 cells treated with DMSO and TRAIL (n = 57) or Yoda1 and TRAIL (n = 40). h TRAIL sensitization of PC3 cells when treated with Yoda1 after scrambled siRNA, cytochrome c (CYCS) and Smac knockdown. a, c, f One representative experiment of three independent experiments. b, d, e, g, h Means and SD of three independent experiments. Statistical analysis was done using one-tailed ANOVA (b, d) and two-tailed unpaired t-test (g, h). *p < 0.05, ***p < 0.005, ****p < 0.001

