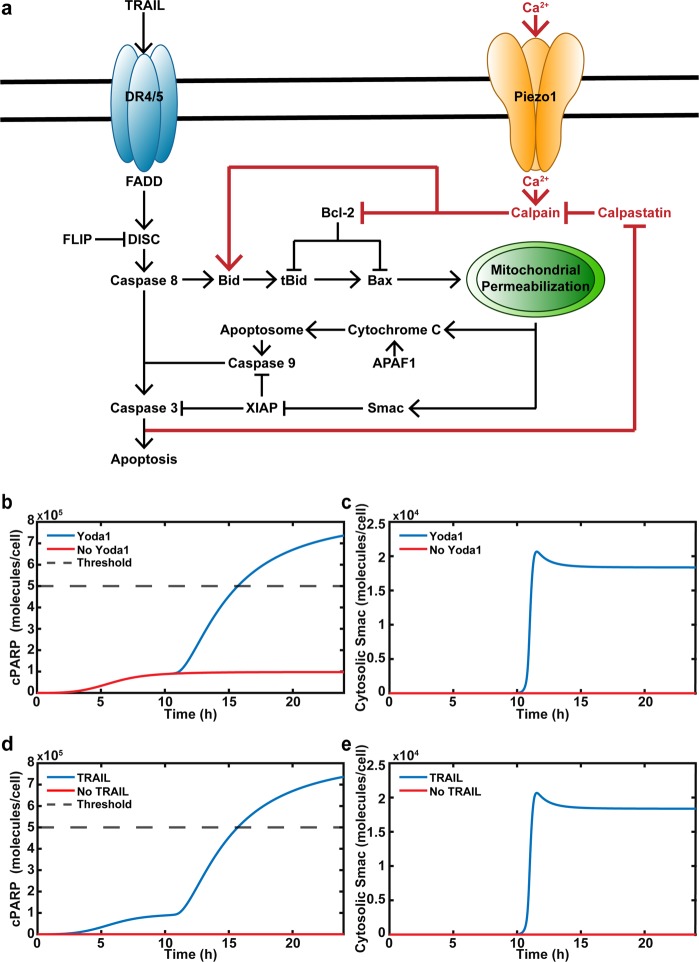
Fig. 4. Baseline computational model of Yoda1 and TRAIL synergy.
a Schematic of calcium and TRAIL-mediated apoptosis. Dark red coloring indicates additions to the computational model. b Apoptosis or cPARP concentration of cancer cells treated with TRAIL with or without Yoda1. Dashed line represents the threshold of cPARP at which cancer cells are considered apoptotic. c Time of MOMP determined by release of Smac, which follows MOMP for cancer cells treated with TRAIL with or without Yoda1. d Apoptosis of cancer cells treated with Yoda1 with or without TRAIL. e Time of MOMP of cancer cells treated with Yoda1 with or without TRAIL

