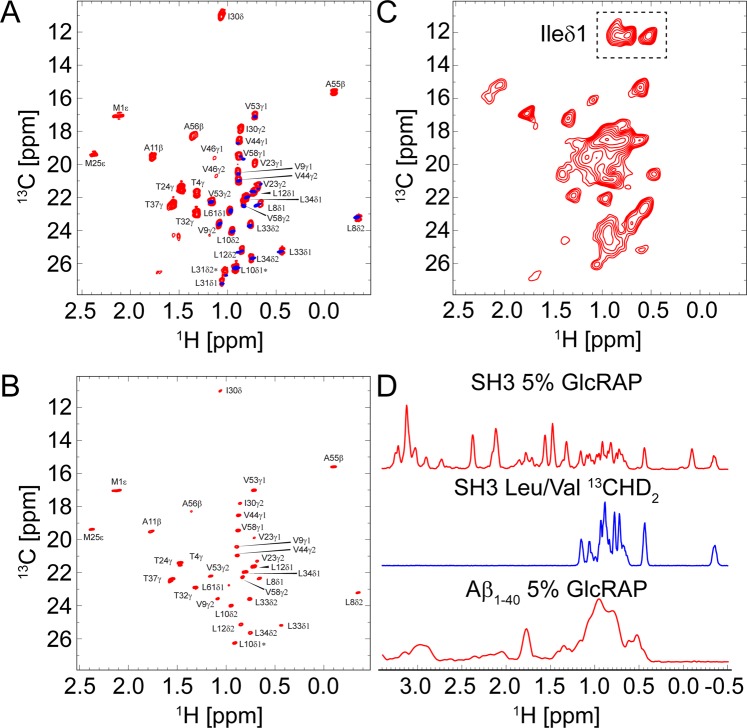
Figure 1.
(A) 2D 1H,13C methyl correlation spectra of a 5% GlcRAP and a Leu/Val 13CHD2 sample of α-spectrin SH3 at an external magnetic field of 14.1 T (600 MHz), adjusting the MAS frequency to 50 kHz and the effective sample temperature to 20–25 °C. All samples were prepared in a 100% D2O buffer (details are given in the Methods part). The 1H, 13C HMQC spectrum of the 5% GlcRAP sample is shown (red) superimposed with the respective spectrum of the Leu/Val sample (blue). The 13C line width of the Leu/Val sample amounts to 25 Hz. The 1H line width for both samples is on the order of ~22–25 Hz. The methyl cross peaks in the 13C dimension of the 5% GlcRAP spectrum are split into doublets due to evolution of the 1JC,C scalar couplings (except for Met). (B) 1H,13C constant-time HSQC spectrum of the 5% GlcRAP sample using a constant-time delay . The 13C line width is ~25 Hz (or ~16 Hz if the indirect evolution period is doubled using mirror-image linear prediction). The apparent 13C methyl T2 time for both samples is roughly around ~30 ms. (C) 1H,13C HMQC spectrum of 5% GlcRAP labelled Aβ1-40 fibrils, recorded at an external magnetic field of 16.4 T (700 MHz) and a MAS frequency of 18 kHz. The 1H line width is on the order of ~130 Hz. (D) 1D projection of 2D 1H,13C HMQC spectra of all samples. All pulse sequences are given in Fig. S1. The figure was generated with Adobe Illustrator CS5 V.15.02.

