Figure 3.
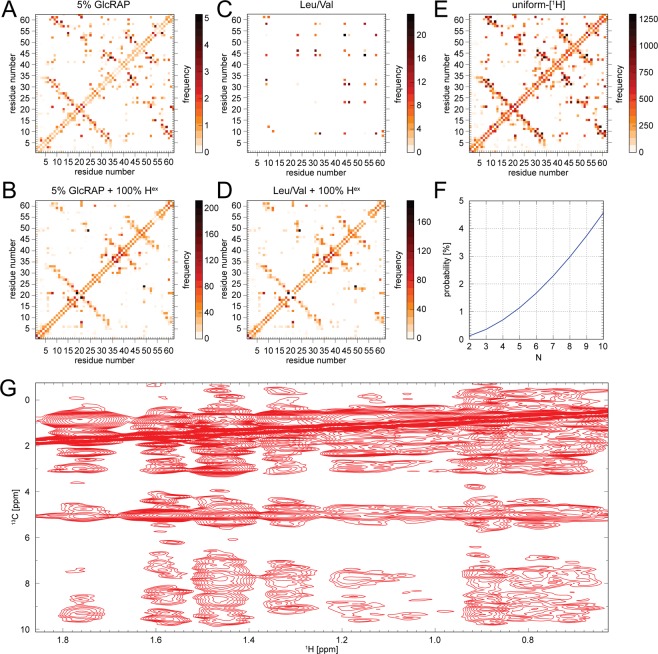
(A–E) 1H,1H contact map for the 1 μs MD relaxed crystal structure of the SH3 domain of α-spectrin for an upper 1H,1H distance limit of 5 Å. The maps were calculated for the (A) 5% GlcRAP and (C) Leu/Val labelling scheme, respectively, as well as for an (E) uniformly protonated sample. Full proton back-substitution was also considered for the former in (B) and (D). (F) The probability P to detect at least one 1H,1H contact for N adjoining sites assuming a likelihood of p = 0.035 to find a proton at a given site. (G) Methyl region of a 1H,1H 2D projection extracted from a 1H-detected 3D H(H)CH RFDR spectrum (τmix = 8 ms) using the 5% GlcRAP labelled SH3 domain12. The spectrum was recorded at an external magnetic field of 14.1 T (600 MHz) and a MAS frequency of 20 kHz. The H2O content in the microcrystalline sample was < 10%. Clearly, a number of 1H,1H contacts were detected including Hmet-Hmet, Hmet-Hali, Hmet-solvent and Hmet-HN. The figure was generated with Adobe Illustrator CS5 V.15.02.

