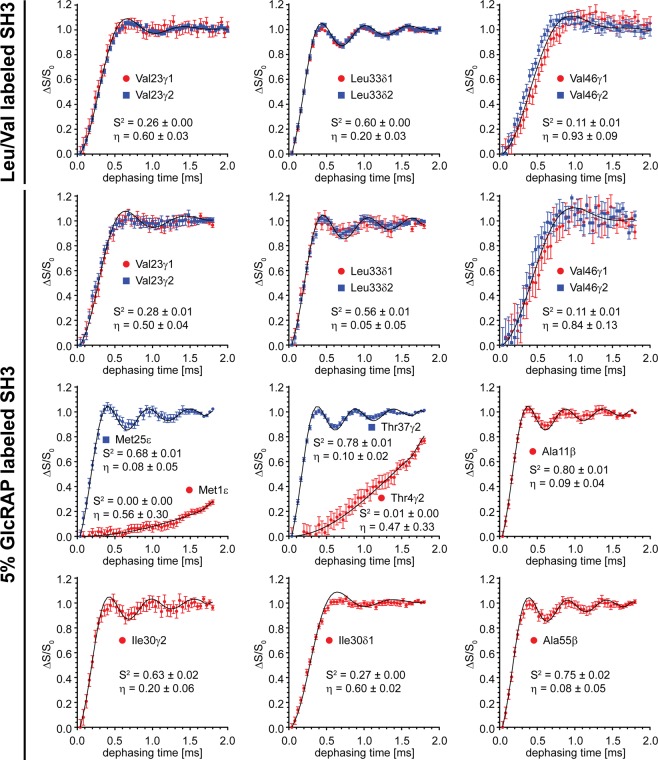
Figure 4.
1H-detected REDOR dephasing curves, using a selectively Leu/Val 13CHD2 methyl labelled and a 5% GlcRAP labelled sample of α-spectrin SH3. The external magnetic field was 14.1 T (600 MHz). The effective temperature of the sample was adjusted to 20–25 °C. The MAS frequency was set to 50 kHz. In the experiment, a ζ-delay of 4 µs was employed. The methyl order parameter S2 (S2axis in Eq. (4)) and the asymmetry η were determined as described in the Methods section. The values are given at the bottom of each plot. In the first two rows, the dephasing curves were fitted by simultaneously minimizing χ2 for both methyl sites (γ1/γ2 for Val and δ1/δ2 for Leu) to improve the fitting convergence. This yielded one order and asymmetry parameter for each Val and Leu residue. However, individual fits for γ1/γ2 (Val) and δ1/δ2 (Leu) were plotted in red and blue to indicate that proR and proS methyl groups show very similar dynamics. The figure was generated with Adobe Illustrator CS5 V.15.02.

