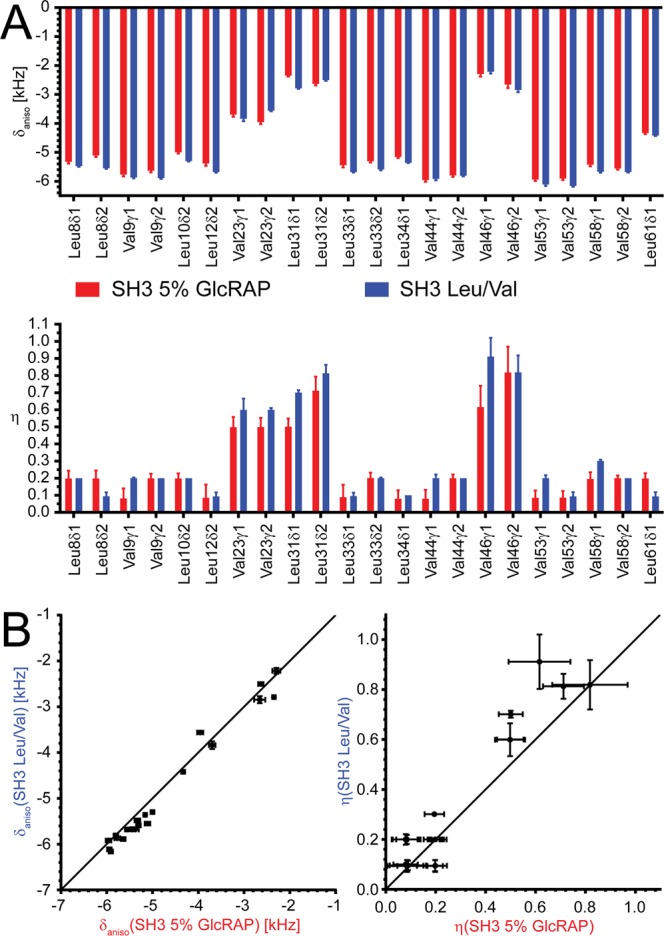
Figure 5.

(A) Dipolar coupling anisotropies δaniso (top) and asymmetries η (bottom), using the 5% GlcRAP (red) and the selectively Leu/Val 13CHD2 methyl labelled sample (blue) of α-spectrin SH3, respectively. All values were determined by fitting REDOR dephasing curves represented in Fig. 4. (B) The anisotropies and asymmetries of both samples are linearly correlated, setting the slope to 1.0 and the y-intercept to 0.0. The linear correlation coefficient R2 is 0.96 and 0.85 for δaniso and η, respectively. The figure was generated with Adobe Illustrator CS5 V.15.02.
