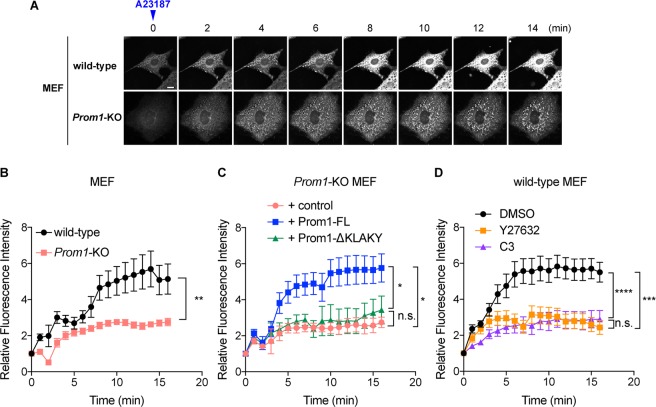
Figure 5.
Prom1 modulates the chloride conductance upon intracellular calcium uptake. (A,B) The calcium-activated chloride efflux is perturbed in the Prom1KO MEFs. (A) The temporal change in fluorescein intensities of MQAE was measured. The wild-type and Prom1KO MEF cells were incubated with low-chloride Kreb’s medium (see materials and methods) and the intracellular calcium uptake was provoked by adding 5 µM of the calcium ionophore A23187 onto the medium (time 0). The temporal change of the fluorescein intensity was imaged at 1 min intervals up to 15 min after the ionophore treatment under the confocal microscope. Representative images are presented. Scale bar, 10 μm. (B) Quantitative data for (A). Eight cells were selected from each of wild-type and Prom1KO cells, and the fluorescein intensities at each time point were quantified. Data are represented as the mean values ± s.e.m. (C) The chloride efflux is rescued by overexpression of Prom1-FL, but not by Prom1-ΔKLAKY in the Prom1KO MEF cells. The expression plasmids conveying Prom1-FL or Prom1-ΔKLAKY were transfected into the Prom1KO MEF cells, and cells were incubated in the presence of MQAE. The transfected cells were identified by YFP expression, and the fluorescein intensities from each transfection were traced. 3 cells for control, 7 cells for Prom1-FL and 8 cells for Prom1-ΔKLAKY were measured. (D) The chloride efflux is perturbed upon the treatment with Rho inhibitors Y27632 and C3. Wild-type MEF cells were treated with DMSO (control), 20 μM of Y-27632 or with 0.5 μg/ml of C3 for 2 hours at the same time of the MQAE treatment and were subjected to the fluorescein measurement as in (B,C). 9 cells for DMSO, 12 cells for Y27632 and 10 cells for C3 were analysed.

