Figure 2.
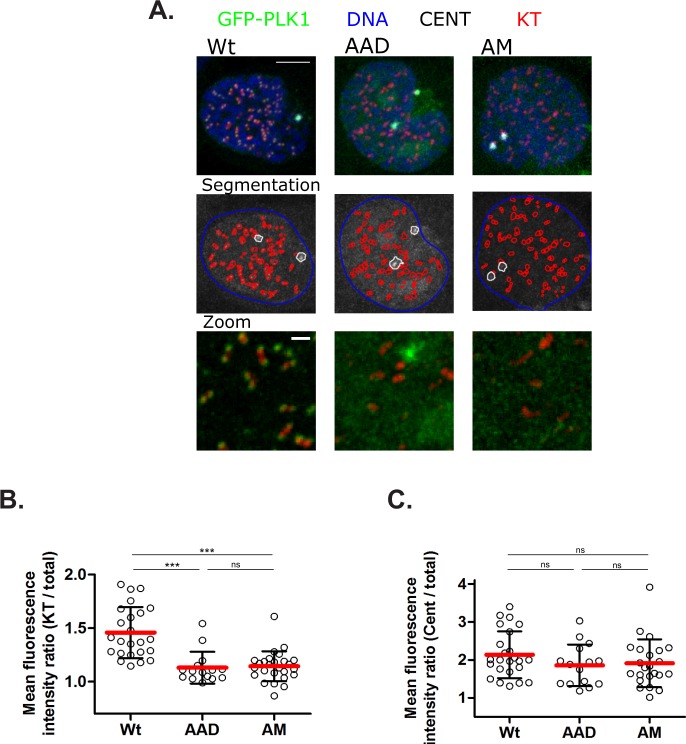
Mutations ablating the Tyr pocket of the PLK1 PBD perturb the dynamics of its intracellular localisation during the cell cycle. (A) Representative maximal-intensity projections of kinetochores (KT) in red, centrosomes (CENT) in white, GFP-PLK1Wt/AAD/AM in green and DNA in blue used for quantification of GFP-PLK1 intensity in (B,C). Cells were treated with Dox (0.5 mg.ml−1) for 7 h, fixed and stained for kinetochores with CREST antiserum, centrosomes with anti-Pericentrin and DNA with Hoechst 33342 and analysed by immunofluorescence microscopy for GFP signal in prophase mitotic cells. Segmentation images show computationally generated segmentations of the DNA (blue), KTs (red) and CENTs (white) used for analysis. Scale bar is 5μm on top panel and 1μm in bottom panel. The images were smoothed, and brightness and contrast settings are constant throughout. (B) Quantification of intensity ratios of GFP-PLK1Wt/AAD/AM on CREST-stained kinetochores (KT) normalized to the corresponding GFP-PLK1 expression in cells. Data from each cell is represented as a hollow circle, horizontal line (red) indicates mean intensity ratio and error bars indicate ± S.D. Statistical analysis was done using non-parametric, Mann-Whitney two-tailed test with 95% confidence interval, ***p < 0.0001, ns = not significant. (C) Quantification of intensity ratios of GFP-PLK1Wt/AAD/AM on Pericentrin-stained Centrosomes (CENT) normalized to the corresponding GFP-PLK1 expression in cells. Data from each cell is represented as a hollow circle, horizontal line (red) indicates mean intensity ratio and error bars indicate ± S.D. Statistical analysis was done using non-parametric, Mann-Whitney two-tailed test with 95% confidence interval, ns = not significant.

