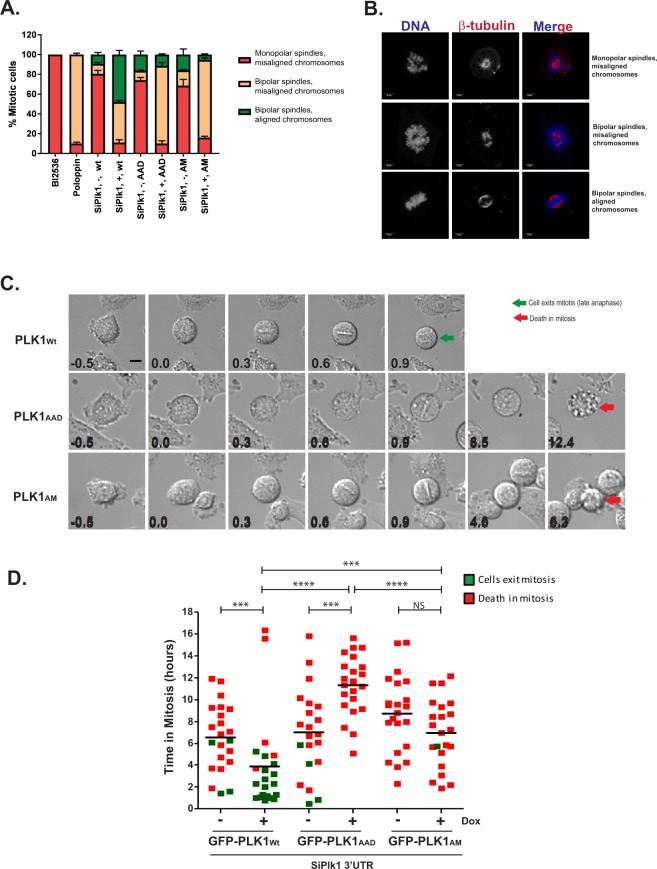
Figure 3.
Mutations ablating the Tyr pocket of the PLK1 PBD impair mitotic progression. (A) HeLa cell lines inducibly expressing GFP-PLK1Wt/AAD/AM were treated with siPlk1 3′UTR both with ( + ) and without (-) Dox or BI2536 or Poloppin as indicated and fixed 24 h later. The fixed cells were stained for spindle microtubules (β-tubulin) and DNA and analysed by microscopy. Mitotic cells were identified by spindle organisation and chromatin condensation, and scored under three categories viz., (1) monopolar spindles and misaligned chromosomes; (2) bipolar spindles with misaligned chromosomes; and (3) bipolar spindles with aligned chromosomes. Data is from two independent experiments, totalling at least 200 cells per condition. Quantification of cellular phenotype in each category in the histogram is represented as mean ± S.D. Treatments with BI2536 and Poloppin were included as control for categories (1) and (2) respectively. (B) Representative images of each category (as in A) used for scoring cells are shown. Scale bar 5μm. (C) Live cell time-lapse images of GFP-PLK1Wt/AAD/AM expressing cells transfected with SiPlk1 3′UTR. Time in hours (h) before (−0.5 h) and after Nuclear Envelope Breakdown (NEBD) (t = 0.0 h) to late anaphase (green arrow)/ death (red arrow) is shown for each cell. Scale bar, 5μm. The images presented are representative of two independent experiments. (D) Duration in mitosis (h) from NEBD to late anaphase/ death, in single cell GFP-PLK1Wt/AAD/AM cells by live cell imaging. Each filled-in square represents data from a single cell and those which complete mitosis are shown in green while those which undergo death are in red. The horizontal line indicates mean time (h) spent in mitosis before cell death. Statistical analysis was with Mann-Whitney two-tailed t-test; ns, not significant; ***p = 0.0003 to 0.0007; ****p < 0.0001. The total number of cells followed in each condition is 22. The data presented is representative of two independent experiments.

