Figure 4.
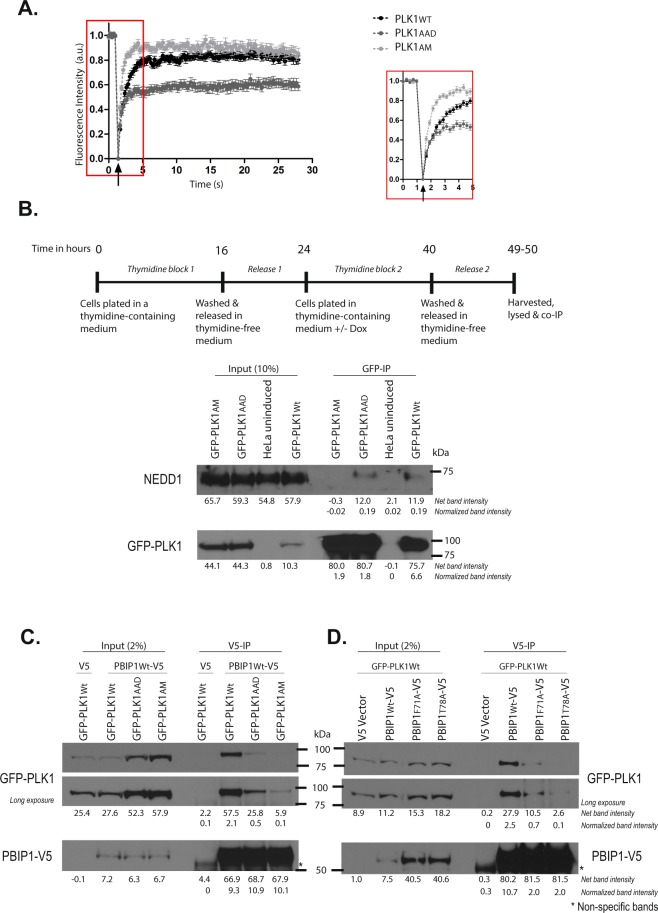
Differential engagement of PLK1 PBD substrates via the Tyr pocket. (A) FRAP analysis of interphase centrosomes in live cells. GFP-PLK1Wt/AAD/AM at the centrosome was photobleached and its recovery monitored at 0.2 s intervals. The median t1/2 time taken for 50% maximal recovery for GFP-PLK1Wt/AAD/AM were found to be 0.7 s, 0.4 s and 0.3 s respectively. The arrowhead indicates the point of photobleaching. An inset shows data points for the first 5 seconds including photobleaching and recovery time of GFP signal. (B) HeLa cells expressing GFP-PLK1Wt/AAD/AM were synchronized in mitosis by double thymidine block and released as shown in the experimental schedule. The cell lysates were immunoprecipitated using GFP-Trap® beads to pull down GFP-PLK1Wt/AAD/AM and analysed by immunoblotting. The data presented is representative of two independent experiments. (C) HeLa cells expressing GFP-PLK1Wt/AAD/AM were transfected with PBIP1Wt-V5 or pcDNA™3.1/V5-HisA vector (or V5 vector) and harvested 24 h later. PBIP1Wt-V5/ V5 was pulled down from the lysates using V5 antibody and immunoprecipitates were analysed by immunoblotting. Asterisks (*) indicate cross-reacting bands. The data presented is representative of two independent experiments. (D) HeLa GFP-PLK1Wt overexpressing cells were transfected with either PBIP1Wt/F71A/T78A-V5 or V5 vector and harvested 24 h later. PBIP1Wt/F71A/T78A-V5 was pulled down from the lysates using V5 antibody and analysed by immunoblotting. Asterisks (*) indicate cross-reacting bands. The data presented is representative of two independent experiments.

