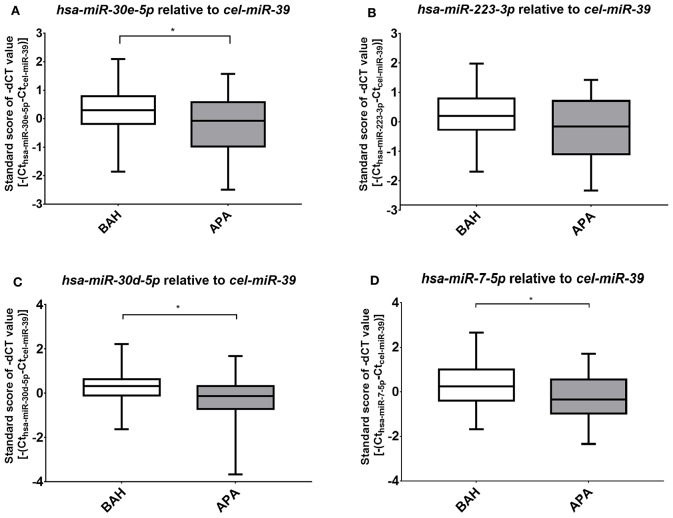
Figure 2.
Results of RT-qPCR of the four miRNAs selected for validation. Mean ± Standard deviation (SD) of standard scores of -dCT values of selected miRNAs; (A) hsa-miR-30e-5p; (B) hsa-miR-223-3p; (C) hsa-miR-30d-5p; (D) hsa-miR-7-5p. Student's t-test with Welch correction or Mann–Whitney test was used based on the result of the Shapiro–Wilks normality test. *p < 0.05.

