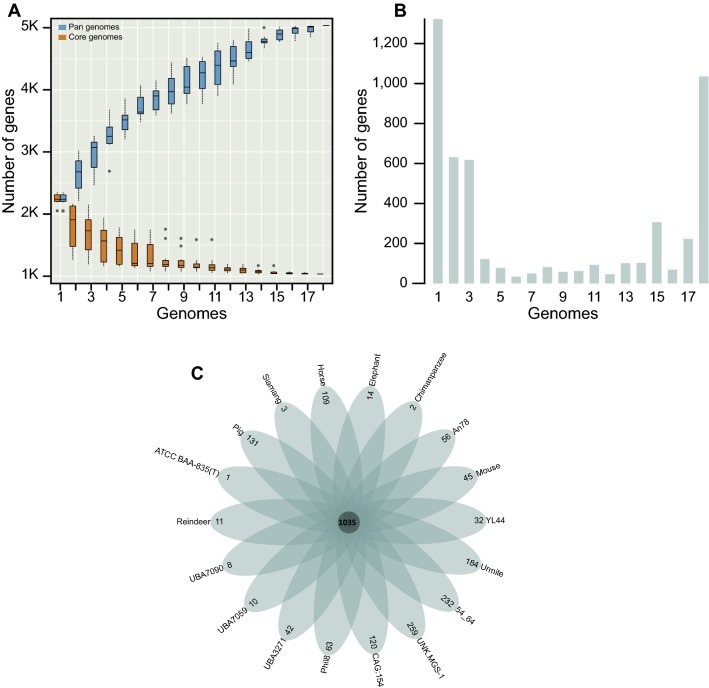
Fig. 2.
Pan-genome analyses of 18 Akkermansia muciniphila strains. a Pan-genome accumulation curves. The blue boxes denote the number of unique genes discovered with the sequential addition of new genomes. The orange boxes denote the number of core genes discovered with the sequential addition of new genomes. b Gene occurrence plot shows the core-genome and additional accessory genes of Akkermansia muciniphila. c Genomic diversity of 18 Akkermansia muciniphila strains. Each strain is shown as an oval. The number of core genomes is shown in the center. Overlapping regions show the genes conserved only within several strains. The numbers in non-overlapping portions show the number of strain-specific genes. The strain name is located beside the oval (color figure online)

