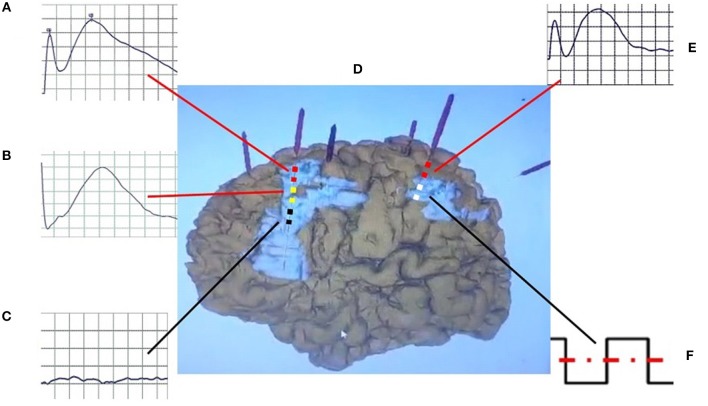
Figure 1.
Schematic diagram of CCEP. The bipolar stimulation (F) was performed in the white contact of electrode in propagation tuber, and positive CCEPs were recorded on the yellow (atypical positive CCEP) (B) and red contacts (typical positive CCEP) (A,E) in the perituberal cortexes and epileptogenic tubers (D), but not on the black (negative CCEP) (C) contacts in the center of epileptogenic tubers. CCEP, cortico-cortical evoked potential.

