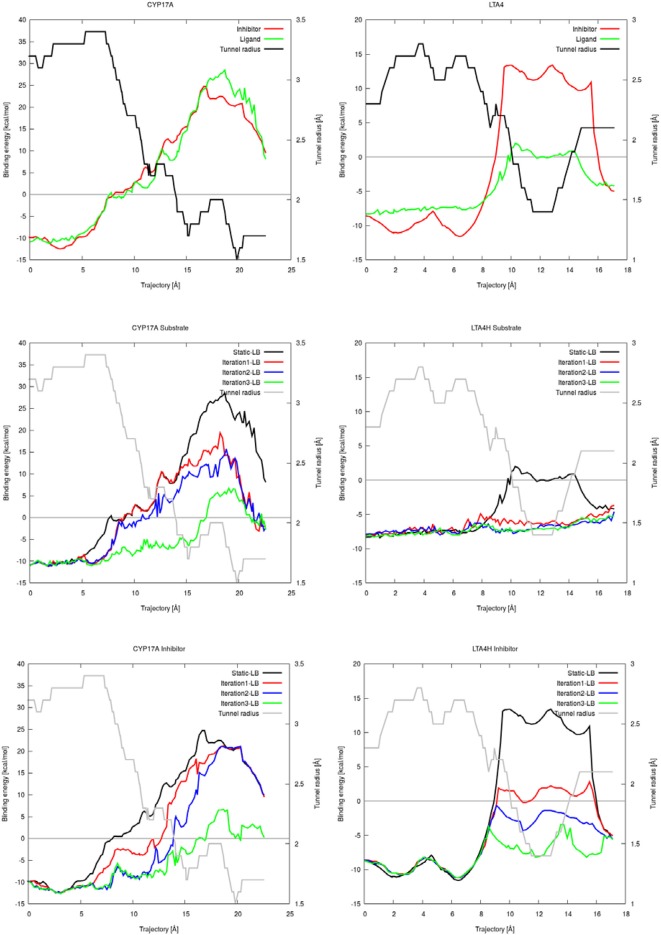
Figure 3.
Plots of the binding energies of cytochrome P450 17A1 (left) and leukotriene A4 hydrolase/aminopeptidase (right) obtained from CaverDock with and without flexibility. Binding energies between substrate and inhibitor with tunnel radius present (top). Binding energies from substrate simulations with flexibility, rigid simulation, and tunnel radius on the background (middle). Binding energies from all inhibitor simulations with flexibility, rigid simulation and tunnel radius on the background (bottom).

