
Figure 8.
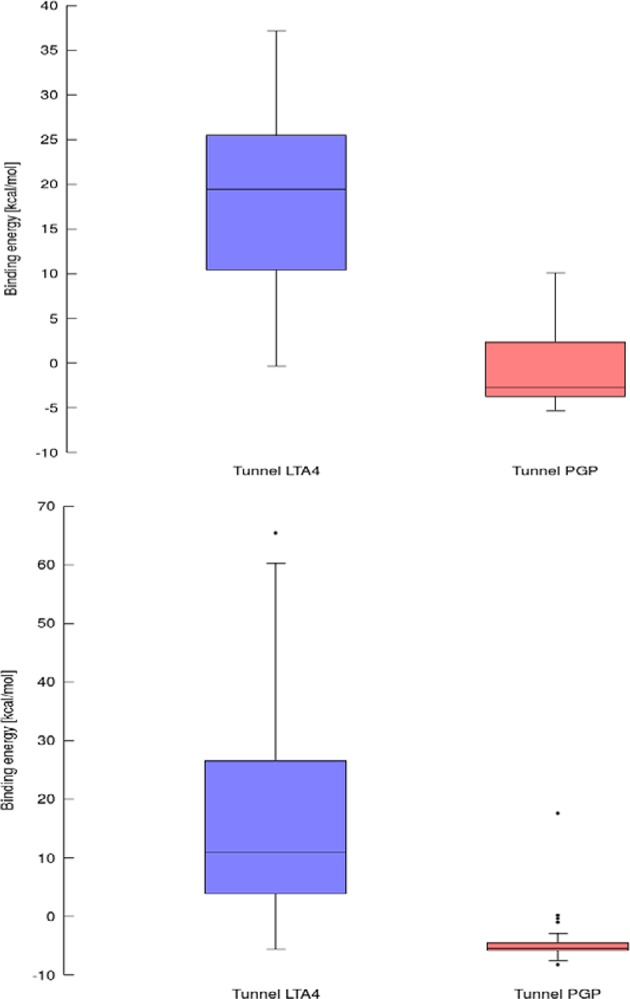
Box and Whiskers plot representing the maxima (energy barriers) for continuous (up) and lower bound (down) trajectories obtained for leukotriene A4 hydrolase/aminopeptidase. Outlying values are indicated by circles.
Official websites use .gov
A
.gov website belongs to an official
government organization in the United States.
Secure .gov websites use HTTPS
A lock (
) or https:// means you've safely
connected to the .gov website. Share sensitive
information only on official, secure websites.
Box and Whiskers plot representing the maxima (energy barriers) for continuous (up) and lower bound (down) trajectories obtained for leukotriene A4 hydrolase/aminopeptidase. Outlying values are indicated by circles.