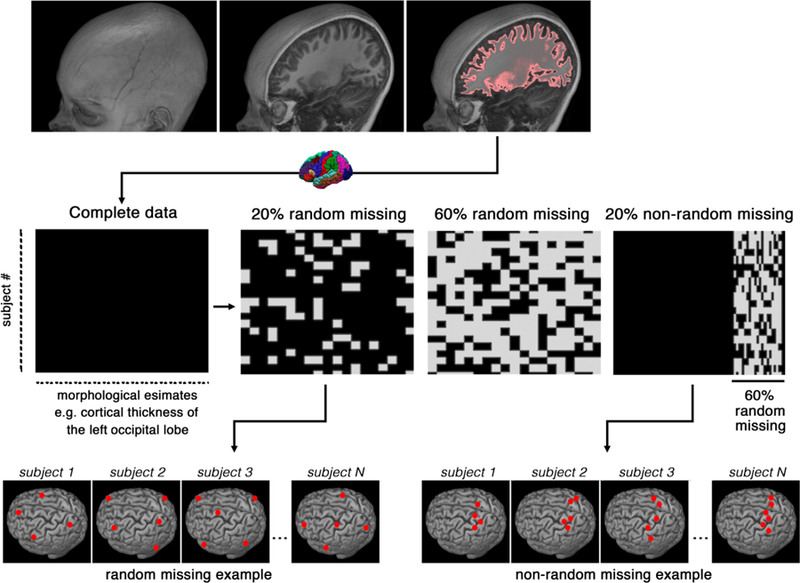
Figure 1.

Schematic representation of the data preparation and types of missingness. The x-axis represents morphological features from FreeSurfer segmentation (e.g., cortical thickness, volume or surface area), the y-axis represents study subjects. Examples of random and non-random missingness are presented at the bottom row.
