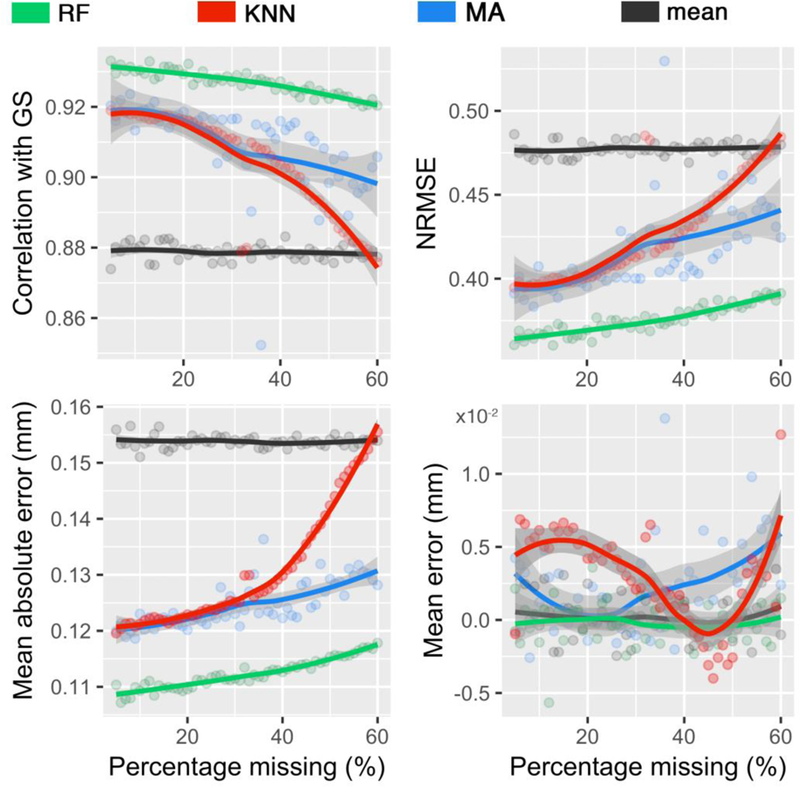
Figure 2.

Performances of different imputation techniques, for a varying percentage of missing values based upon the missing completely at random (MCAR) assumption. Imputed values were compared against the gold standard (GS) values. Techniques include random forest (RF), k-nearest neighbors (KNN), low-rank matrix approximation (MA), and mean. The gray zone around each line displays 0.95 confident interval around at each percentage.
