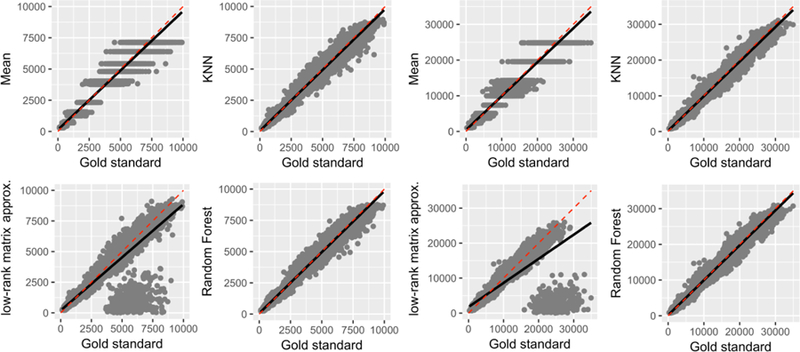
Figure 7.

Correlations of predicted cortical area (left) and volume (right) values with the gold standard under the missing not at random (MNAR) assumption at 20% missing in total (i.e., 60% of missing data was simulated under the MNAR assumption in 30% of the original data, making for 20% missing in total). Note that low-rank matrix approximation technique failed to converge in number of instances.
