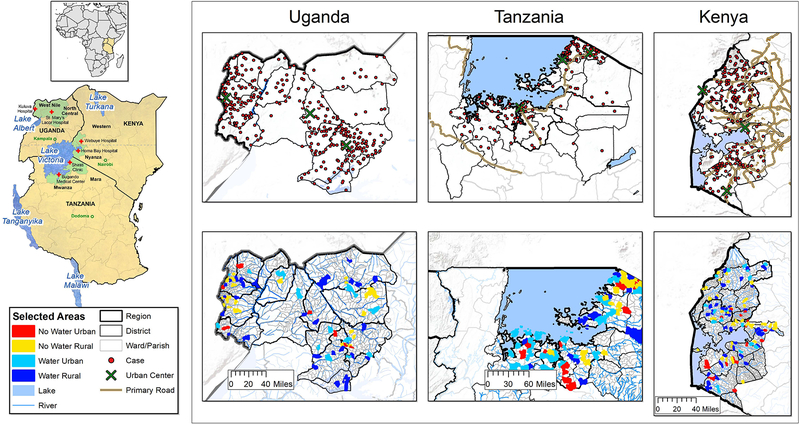
Figure 1.
Map showing the EMBLEM study area marked with green shading and the participating hospitals marked with a red cross (St. Mary’s Hospital, Lacor and Kuluva Hospital in Northern Uganda; Bugando Medical Center and Shirati District Hospital in Northern Tanzania; Homa Bay District and Webuye District Hospitals and Moi University Teaching and Referral Hospital in Western Kenya). Two regions were selected per country. A locator map shows East Africa within Africa. Multi-panel maps show the zoom out of the study areas for each country. The bottom row shows the relief features, including rivers and the location of 100 villages randomly sampled per country as a source of matched population controls. The sampled villages are indicated according to their stratification category, that is, proximity to water and population density (see “Methods” section). The upper row shows the geographical distribution of the cases that were enrolled in the EMBLEM study plotted within their district of origin (large urban centers are marked on the map). The primary all season roads serving the study areas are included to give a rough idea of the geographical dispersion of cases in relation to the villages where the matched population controls were sampled and the transport infrastructure in the study areas.

