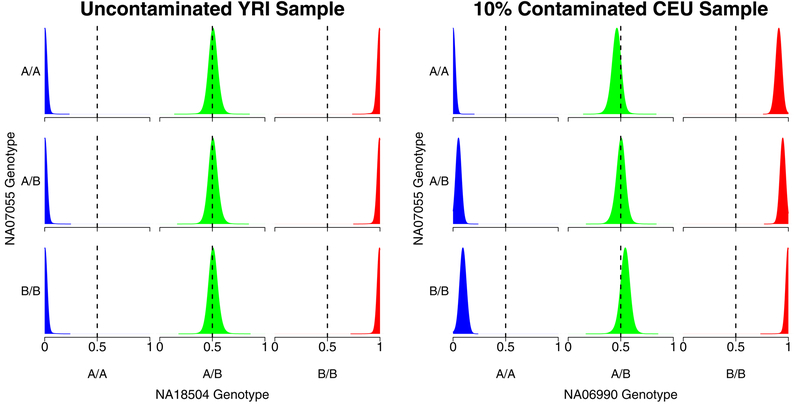
Figure 2:
Kernel density plots showing the distribution of array probe intensities for an uncontaminated HapMap Yoruban sample (NA18504, left) and a 10% contaminated HapMap European sample (NA06990, right) as a function of the genotypes of NA07055. It is apparent that the intensities of the contaminated sample shift in the direction of NA07055 genotypes.

