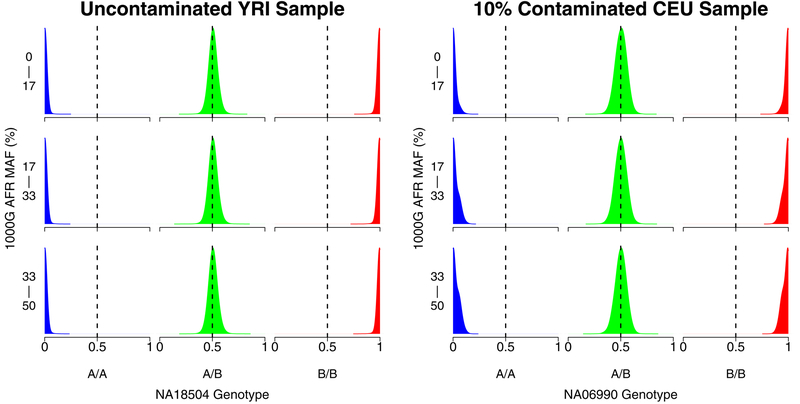
Figure 5:
Kernel density plots showing the distribution of array probe intensities for an uncontaminated HapMap Yoruban sample (NA18504, left) and a 10% contaminated HapMap European sample (NA06990, right) at different 1000 Genomes African minor allele frequency (MAF) bins. The sample NA07055 that contributed DNA to the contaminated sample on the right is European while the MAFs were calculated from African samples, so using the MAFs to estimate contamination with a method like BAFRegress in this case would result in a dramatic underestimate for the intended contamination of 10%.

